


The CYFIRMA Industry Report delivers original cybersecurity insights and telemetry-driven statistics of global industries, covering one sector each week for a quarter. This report focuses on the automotive industry, presenting key trends and statistics in an engaging infographic format.
Welcome to the CYFIRMA infographic industry report, where we delve into the external threat landscape of the automotive industry over the past three months. This report provides valuable insights and data-driven statistics, delivering a concise analysis of attack campaigns, phishing telemetry, and ransomware incidents targeting the automotive industry.
We aim to present an industry-specific overview in a convenient, engaging, and informative format. Leveraging our cutting-edge platform telemetry and the expertise of our analysts, we bring you actionable intelligence to stay ahead in the cybersecurity landscape.
CYFIRMA provides cyber threat intelligence and external threat landscape management platforms, DeCYFIR and DeTCT, which utilize artificial intelligence and machine learning to ingest and process relevant data, complemented by manual CTI research.
For the purpose of these reports, we leverage the following data from our platform. These are data processed by AI and ML automation based on both human research input and automated ingestions.
While this report contains statistics and graphs generated primarily by automation, it undergoes thorough review and enhancement for additional context by CYFIRMA CTI analysts to ensure the highest quality and provide valuable insights.
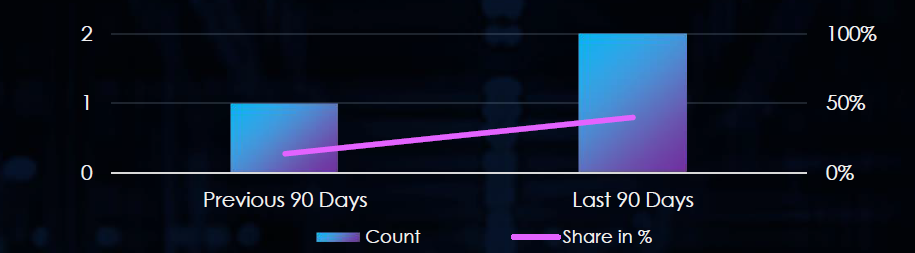
Automotive organizations did feature in 2 of the 5 observed campaigns, which is a presence in 40% of all campaigns. This is an increase from 1 in 7 campaigns and 14% presence in the previous 90-day period.

Observed campaigns are distributed intermittently and alternate between months.
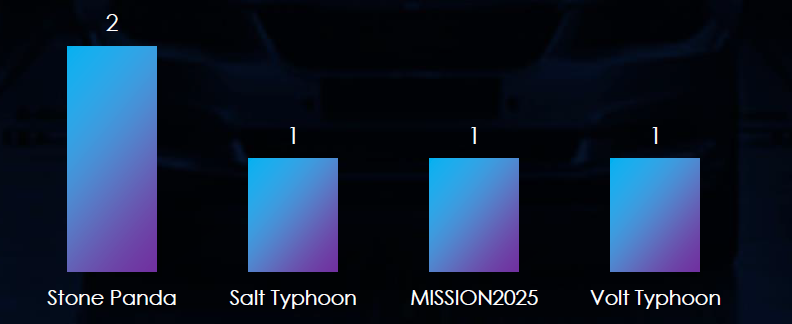
The observed campaigns are attributed to multiple Chinese threat actors. We observe overlapping TTP between older naming conventions (Stone Panda, MISSION2025) and new tool-based Typhoon names. We hypothesize these are most likely the same or re-organized nation-state teams.
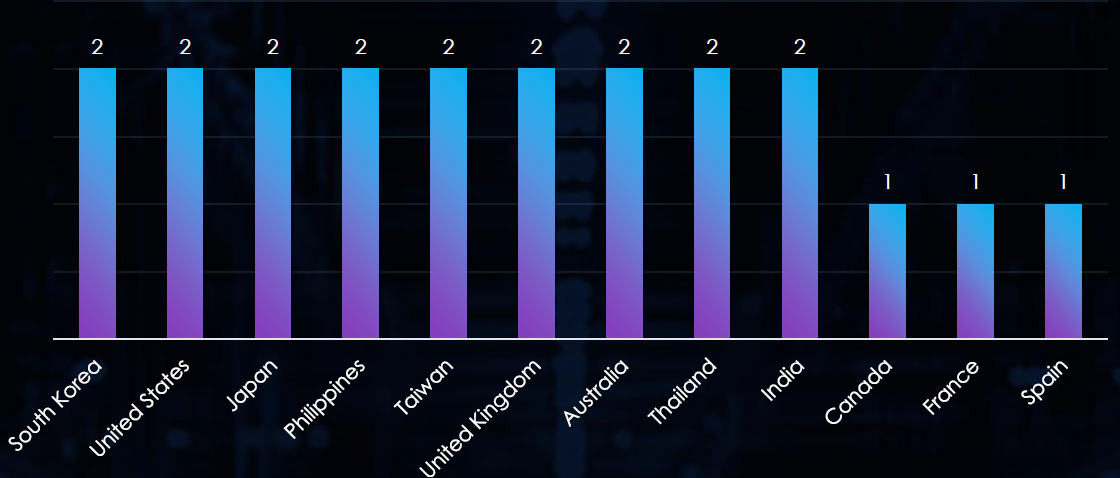
Victims of observed attack campaigns have been recorded in 12 different countries. Most recorded victims are in both campaigns. Between Asia, NATO, and listed QUAD alliance countries are of geopolitical interest to the Chinese government.
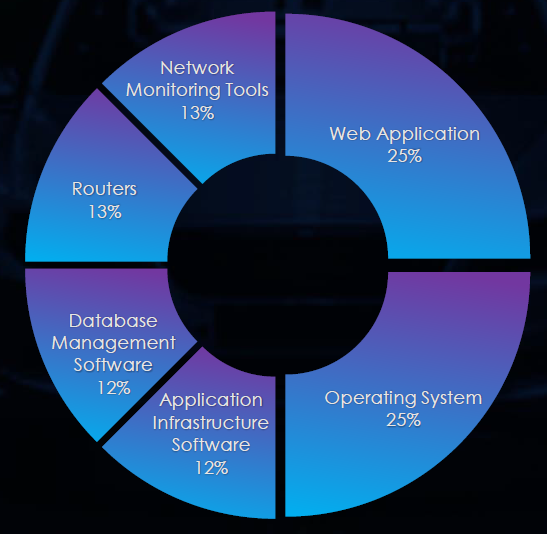
Both the observed campaigns targeted web applications and operating systems. Furthermore, database management software, routers, network monitoring tools, and application infrastructure software were also targeted.

Risk Level Indicator: Medium
In the past 90 days, automotive organizations have been moderately affected by advanced persistent threat (APT) campaigns. 2 in 5 observed APT campaigns targeted the automotive industry, representing a 40% presence.
This represents an increase from the previous 90-day period when 1 out of 7 campaigns targeted the automotive industry.
Monthly Trends
The observed campaigns occurred during January and March.
Key Threat Actors
The campaigns are attributed to Chinese threat actors Salt Typhoon and Volt Typhoon.
Geographical Impact
The campaigns have affected a total of 12 countries, seemingly distributed randomly across continents. However, most countries are also of interest to the Chinese Communist Party (CCP).
Targeted Technologies
Web applications and operating systems remain the most frequently targeted technology. Additionally, database management, routers, network monitoring tools, and application infrastructure software have been compromised.
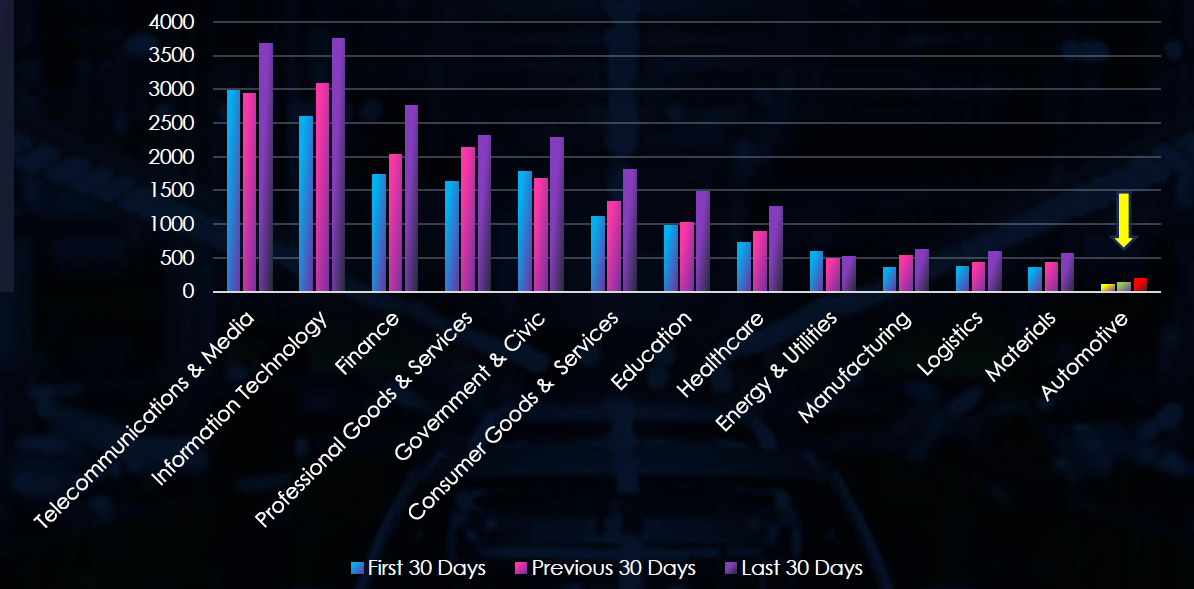
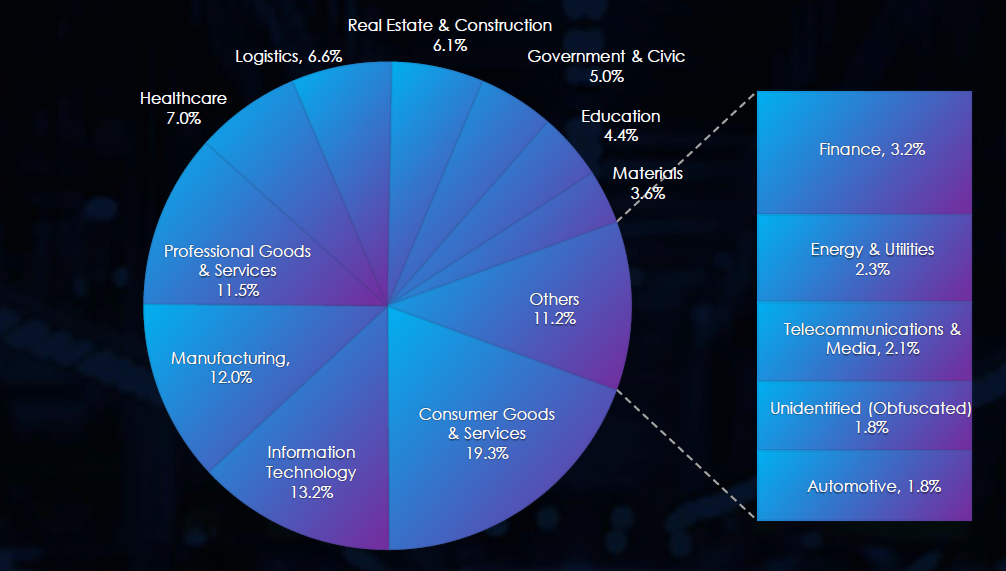
Over the past three months, CYFIRMA’s telemetry has identified 443 mentions of automotive out of a total of 53,681 industry mentions. This is from a total of 502,166 posts across various underground and dark web channels and forums.
Automotive ranked as the least frequently mentioned industry in the last 90 days with a share of 0.82% of all detected industry chatter.
Below is a breakdown of 30-day periods of all mentions.
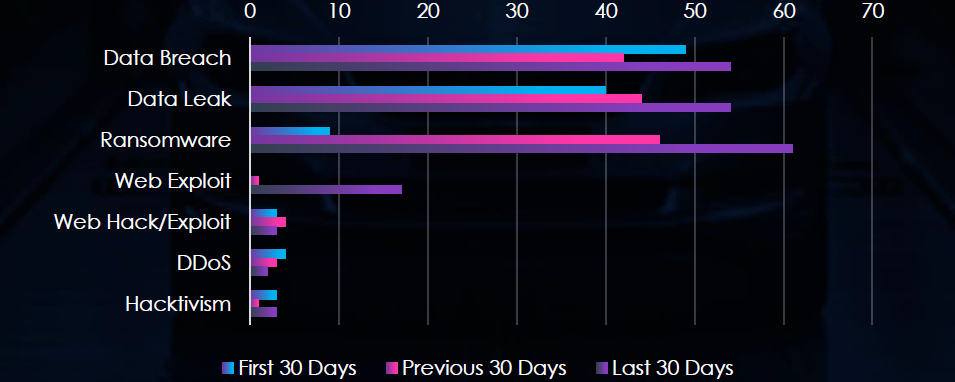
Data breaches, data leaks, and ransomware were the top three categories of recorded cyber threats for the automotive industry. Notably, there was a significant increase in ransomware and web exploits in the last 30 days.

Risk Level Indicator: Low
In total, automotive comprises 0.82% of all detected industry underground and dark web chatter in the last 90 days, ranking as the least frequently mentioned industry.
Below are the observed key trends across 90 days.
Steady Increase in Mentions (+80%)
108 (Jan) → 141 (Feb) → 194 (Mar)
Top Threats (March 2025)
Ransomware: 61 (↑578% since Jan)
Data Breach & Leak: 54 each (both ↑35%)
Web Exploit: 17 (from 0 in Jan)
Ransomware Spike
9 (Jan) → 46 (Feb) → 61 (Mar)
Web Exploits Emerging Rapidly
0 (Jan) → 1 (Feb) → 17 (Mar)
DDoS Attacks Declining
4 (Jan) → 3 (Feb) → 2 (Mar)
Hacktivism is Minimal & Inconsistent
Low mentions (3 → 1 → 3)
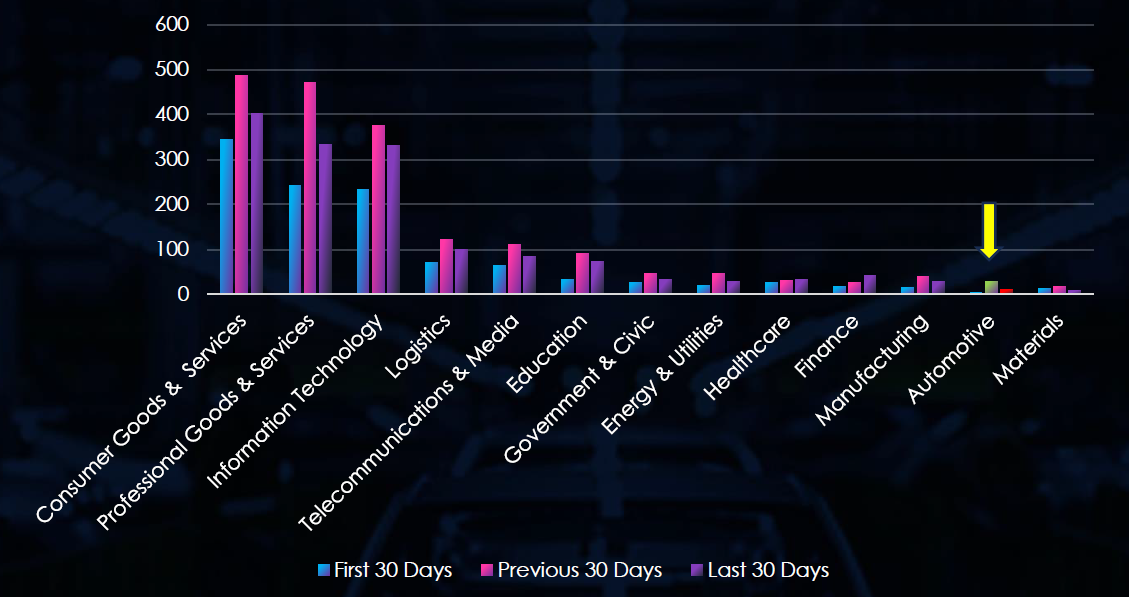
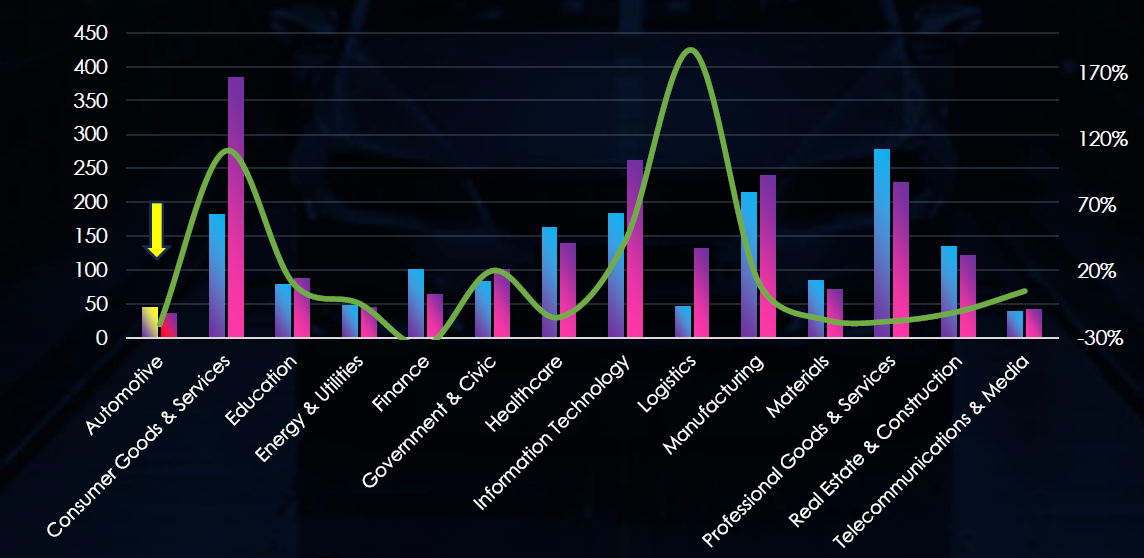
Over the past three months, CYFIRMA’s telemetry has identified 43 mentions of automotive out of a total of 4,542 industry mentions. This is from a total of 10,517 CVEs published in 90 days.
The automotive industry ranked as the 2nd least frequently mentioned industry in the last 90 days with a share of 0.95% of all detected industry chatter.
Below is a breakdown of 30-day periods of all mentions.
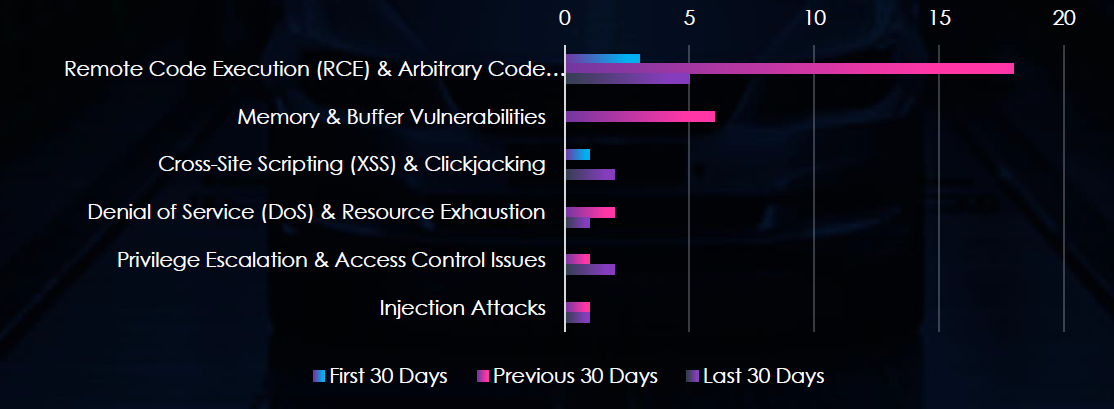
Remote & Arbitrary Code Execution are the most common vulnerabilities, along with Memory & Buffer vulnerabilities they recorded a notable increase in the middle of the last 90-day period.
Risk Level Indicator: Low
In total, automotive comprises 0.95% of all detected industry vulnerabilities in the last 90 days, ranking as the 2nd least frequently mentioned industry.
Below are the observed key trends across 90 days.
Spike in February, Drop in March
Jan: 4 → Feb: 28 → Mar: 11
February saw a significant surge, but mentions dropped by over 60% in March.
February Surge Driven by RCE Vulnerabilities
Jan: 3 → Feb: 18 → Mar: 5
RCE was the main driver of the February spike, signaling critical exposure.
March Focus: Privilege Escalation & Web-Based Threats
Privilege Escalation: Increased to 2 in March (from 0 in Jan)
Cross-Site Scripting (XSS): 2 in March (up from 0 in Feb)
Low But Persistent Vulnerabilities
Injection Attacks: 1 each in Feb & Mar
Denial of Service: Minimal activity across months
Memory/Buffer Issues: Only seen in Feb (6 mentions)
In the past 90 days, CYFIRMA has identified 36 verified ransomware victims in the automotive industry. This accounts for 1.8% of the overall total of 1,987 ransomware victims during the same period, placing the automotive industry as the least frequent victim of ransomware.
Furthermore, a quarterly comparison reveals a mild decrease of interest in the automotive industry of -20% from 45 to 36 victims. The overall share increased from 2.6% to 1.8%.
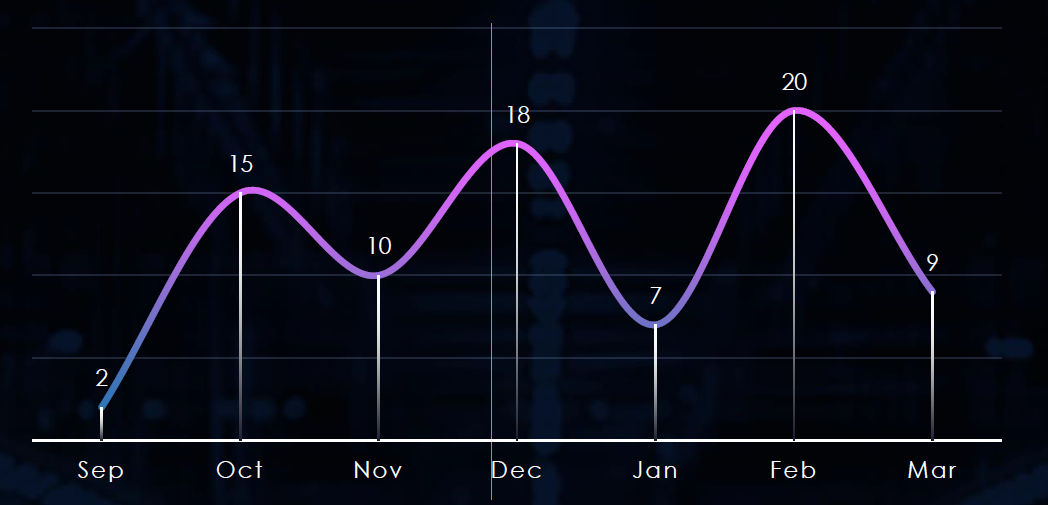
Over the past 180 days, we have observed swinging activity across months. This is largely due to relatively low activity overall. However, the activity remains sustained, and it is important to note that the automotive industry is considerably narrow in scope compared to other industry categories tracked.
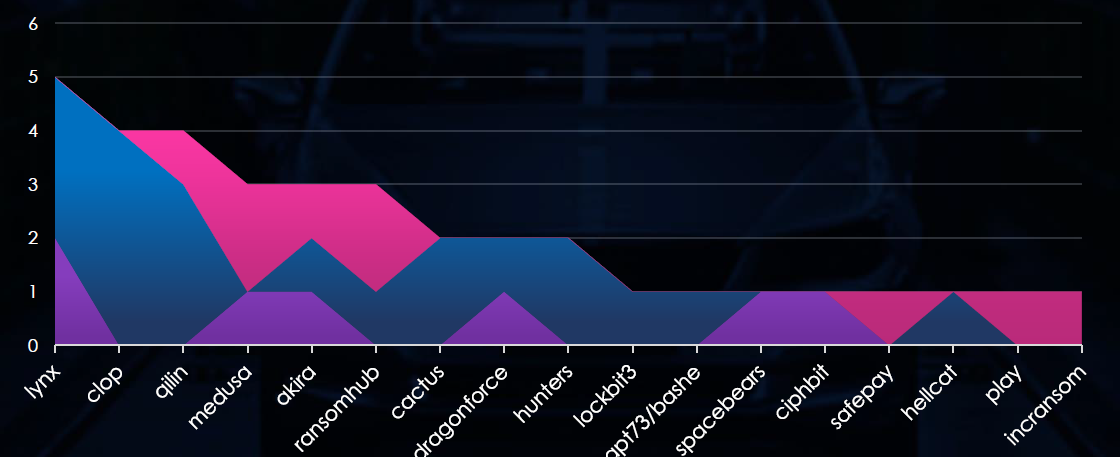
A breakdown of the monthly activity provides insights into which gangs were active each month. For example, the second most active gang Cl0p recorded all victims in February. On the other hand, the Medusa gang recorded victims only in January and March.
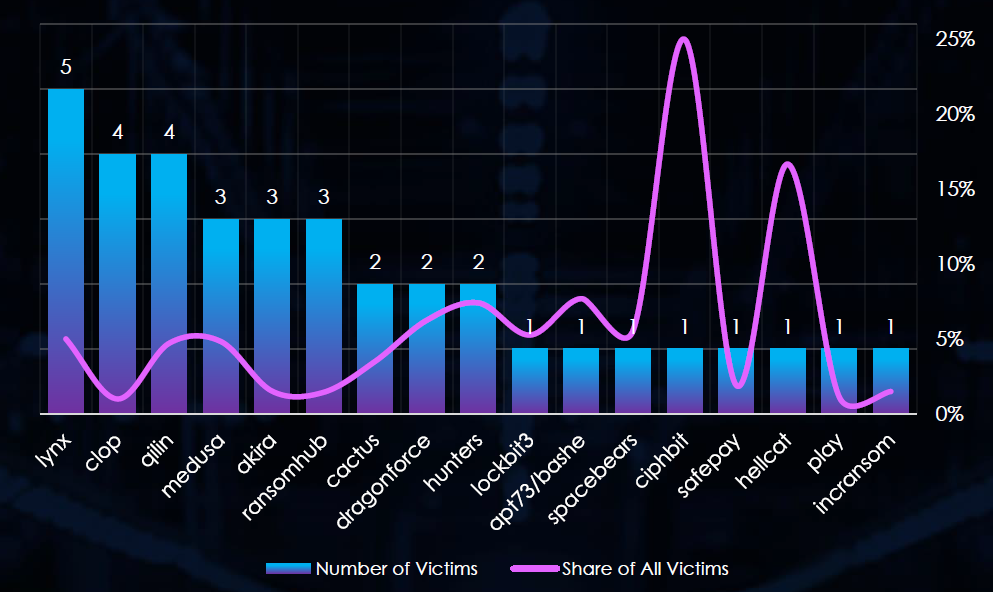
In total 17 out of 64 gangs were active in last 90 days. Lynx gang recorded the most victims (5), followed by Cl0p (4), and Qilin (4).
The share of all victims for most gangs in this industry is relatively low, with the exception of Ciphit (25%) and Hellcat (16.7%). But those are skewed by an overall small number of victims by the respective gangs.
Out of top 10 gangs 7 have around 5-6% share, and 3 are below 2%.
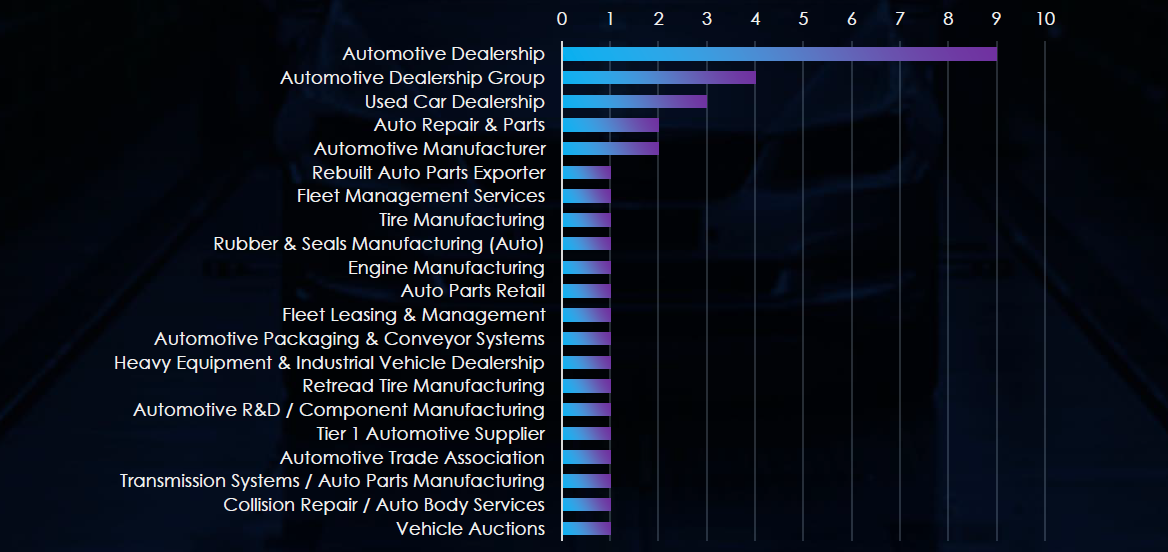
Dealerships are by a large margin the most frequent automotive victims of ransomware.
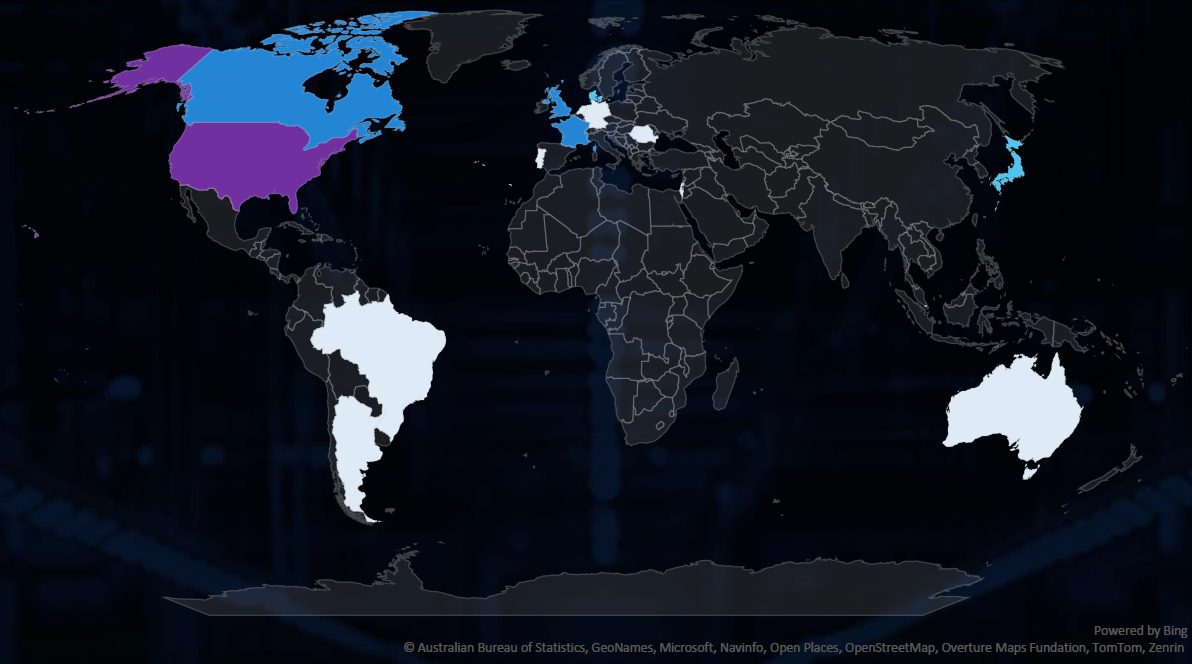
The geographic distribution heatmap underscores the widespread impact of ransomware, highlighting the countries where victims in this industry have been recorded. Notable is its growing presence in Latin America.
The chart shows quarter-to-quarter changes in targeted countries. Data is sorted by last 90 days and compared to previous 90 days marked blue.
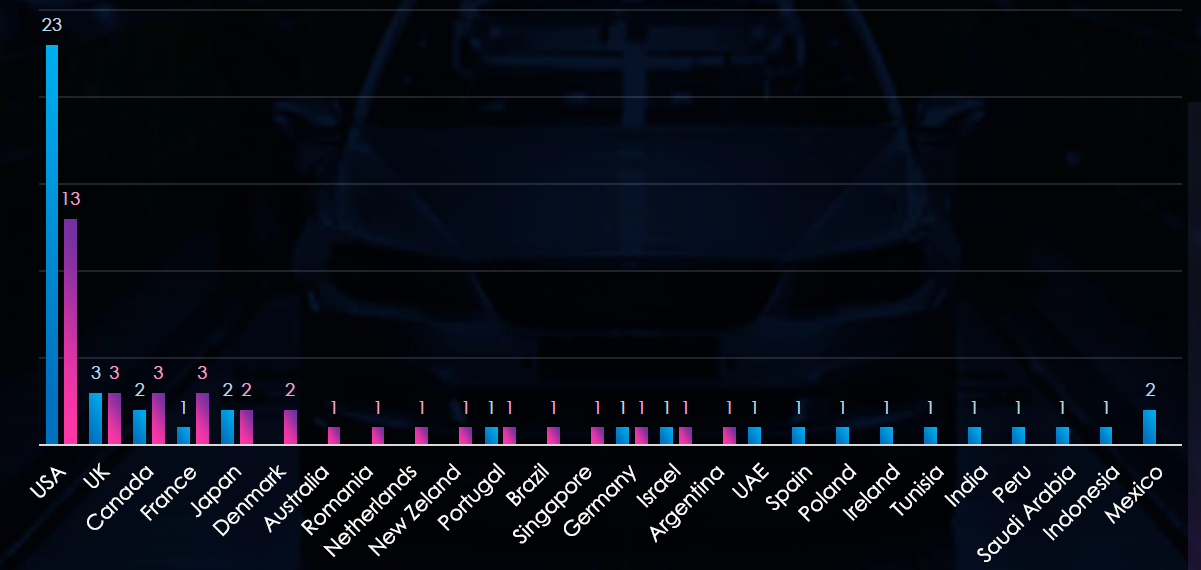
We can see the USA dominating the automotive ransomware victimology followed by the UK, Canada, France, and Japan.
Risk Level Indicator: Low
The automotive industry is placed as the least frequent victim, recording only 36 victims in the last 90 days.
Overall share decreased from 2.6% to 1.8% of all ransomware victims.
Monthly Activity Trends
Ransomware activity in the automotive industry was generally low with swinging activity across months.
Lynx was the most active gang overall followed by Cl0p and Qilin.
Ransomware Gangs
A total of 17 out of 64 active ransomware groups targeted this industry in the past 90 days:
Lynx: The most active with 5 victims and 5% of their victims are from the automotive sector (5 out of 100 victims).
Cl0p: Second most active with a share of only 1.0% victims in this industry (4 out of 401 victims). It presents a risk due to high activity.
Overall 7 out of the top 10 gangs recorded ~5%+ share of their victims in the automotive industry, the other 3 were below 2%, suggesting no high focus.
Geographic Distribution
The geographic distribution of ransomware victims in the automotive industry is mostly represented by the USA (13) accounting for 36% of all victims. The UK, Canada, France, Japan and Denmark are in the top 5 most attacked countries.
In total, 16 countries recorded ransomware victims in this industry in the last 90 days, which is an increase from 18 countries in the previous 90 days.
For a comprehensive, up-to-date global ransomware tracking report, please refer to our new monthly “Tracking Ransomware” series here.
Over the past 90 days, the automotive industry faced a moderate risk from APT campaigns, limited but growing underground chatter, a low vulnerability volume with a notable February spike, and relatively low ransomware activity:
APT Campaigns: Two of five observed campaigns (40%) targeted automotive—an increase from the previous 90-day period. Chinese threat actors Salt Typhoon and Volt Typhoon were implicated, impacting 12 countries. Attacks primarily targeted web applications, operating systems, and additional infrastructure components such as routers and network monitoring tools.
Underground and Dark Web Chatter:Automotive made up only 0.82% of detected chatter (least among monitored sectors), yet mention volumes rose by 80%. Ransomware references surged by 578% (to 61 mentions) from January to March, and web exploits jumped significantly in March. DDoS activity declined, while hacktivism remained sporadic.
Vulnerabilities: The sector accounted for 0.95% of identified vulnerabilities, ranking as the second least mentioned. A sharp spike in February was predominantly driven by remote code execution (RCE) flaws. During March focus shifted toward privilege escalation and web-based threats, with memory/buffer issues prominent only in February.
Ransomware:Automotive was the least targeted sector, recording 36 victims (1.8% share, down from 2.6%). Lynx had the most confirmed victims (5), accounting for 5% of its total. The U.S. led victim geography at 36%, followed by the U.K., Canada, France, Japan, and Denmark. Overall, attacks were dispersed across 16 countries, up slightly from 18 in the prior period.