

The CYFIRMA Industry Report delivers original cybersecurity insights and telemetry-driven statistics of global industries, covering one sector each week for a quarter. This report focuses on the energy & utilities industry, presenting key trends and statistics in an engaging infographic format.
Welcome to the CYFIRMA infographic industry report, where we delve into the external threat landscape of the energy & utilities industry over the past three months. This report provides valuable insights and data-driven statistics, delivering a concise analysis of attack campaigns, phishing telemetry, and ransomware incidents targeting the energy & utilities industry.
We aim to present an industry-specific overview in a convenient, engaging, and informative format. Leveraging our cutting-edge platform telemetry and the expertise of our analysts, we bring you actionable intelligence to stay ahead in the cybersecurity landscape.
CYFIRMA provides cyber threat intelligence and external threat landscape management platforms, DeCYFIR and DeTCT, which utilize artificial intelligence and machine learning to ingest and process relevant data, complemented by manual CTI research.
For the purpose of these reports, we leverage the following data from our platform. These are data processed by AI and ML automation based on both human research input and automated ingestions.
While this report contains statistics and graphs generated primarily by automation, it undergoes thorough review and enhancement for additional context by CYFIRMA CTI analysts to ensure the highest quality and provide valuable insights.
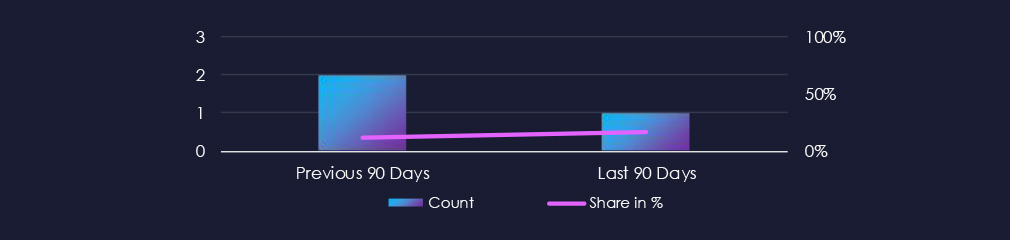
Energy & utilities organizations featured in 1 out of the 6 observed campaigns, which is a presence in 17% of all campaigns, a drop from 2 campaigns and 12% presence in the previous 90-day period.
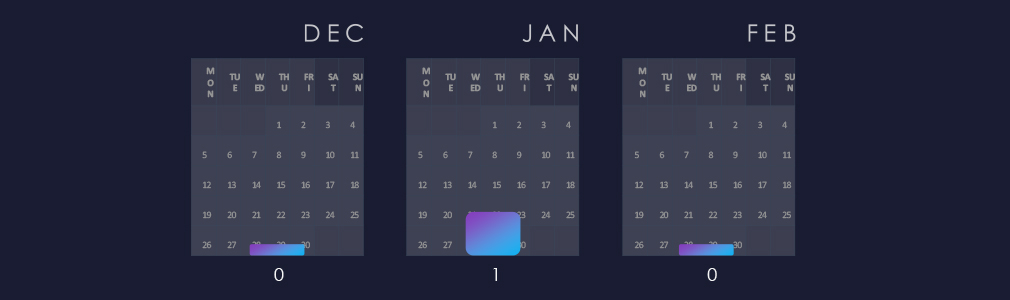
Observed campaigns are distributed intermittently and alternate between months.

In the one observed campaign we detected overlapping TTPs for the Volt Typhoon and MISSSION2025 nexus of activities, which includes APT41.
Both APT41 and Volt Typhoons can be linked to Chinese Military, and we can hypothesize there is collaboration between units and/or change of tools.
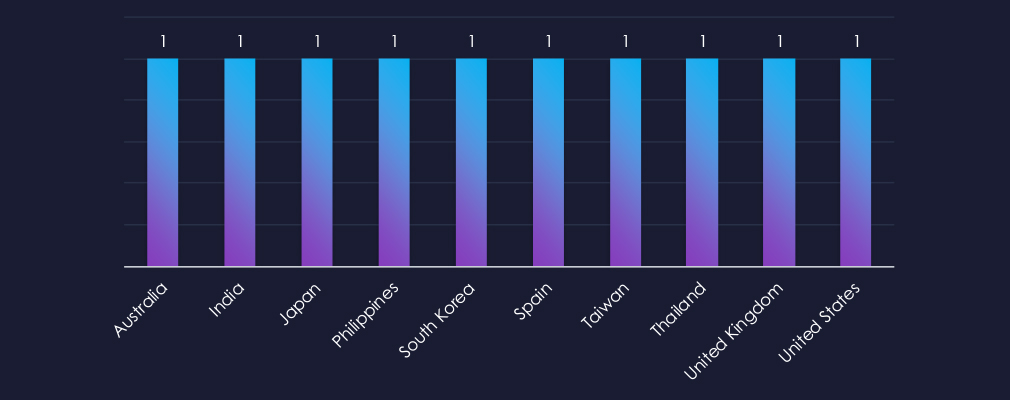
Victims of the observed attack campaign span 11 different countries.
Given the involvement of Chinese threat actors with links to the military, we can see geopolitical countries of interest to the Chinese Communist Party.
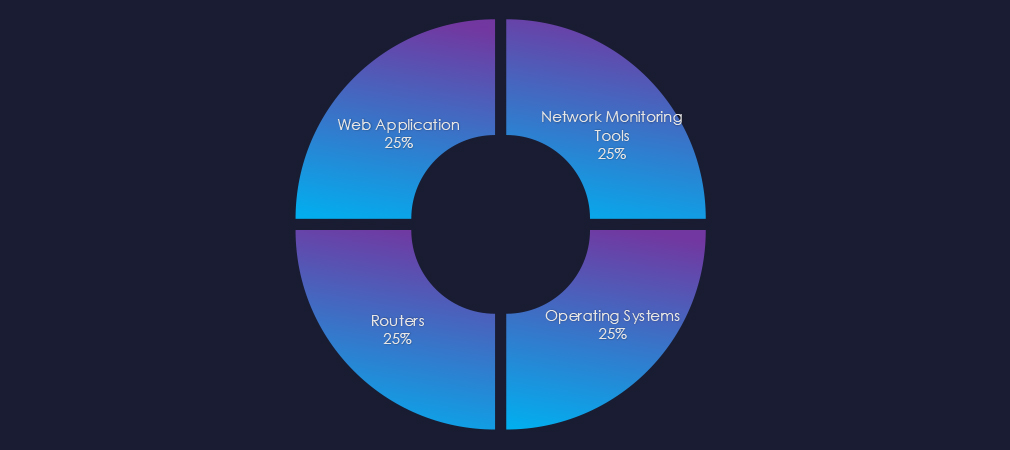
The observed campaign targeted web applications, operating systems, network monitoring tools, and routers.

In the past 90 days, energy & utilities organizations have not been significantly affected by advanced persistent threat (APT) campaigns. The industry was present in only 17% of the observed campaigns.
Monthly Trends
A single observed campaign was observed in December.
Key Threat Actors
The campaign is attributed to Chinese threat actors with links to the military.
Geographical Impact
The campaigns have affected a total of 11 countries of geopolitical interest to the Chinese Communist Party (CCP).
Targeted Technologies
The observed campaign targeted web applications, operating systems, network monitoring tools, and routers.
Over the past three months, CYFIRMA’s telemetry has identified 31 out of a total of 192,716 phishing campaigns with an energy & utilities theme. This represents a significant decrease from 56 campaigns and a corresponding reduction in the overall share from 0.032% to 0.016% compared to the previous 90-day period.
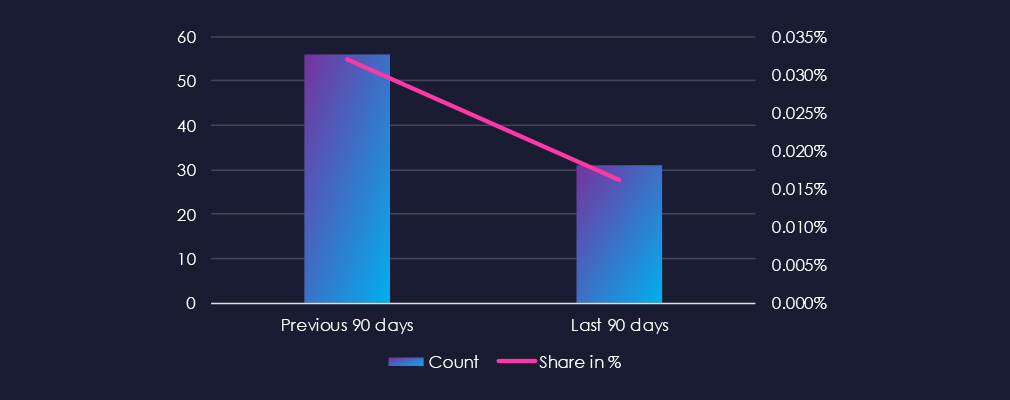
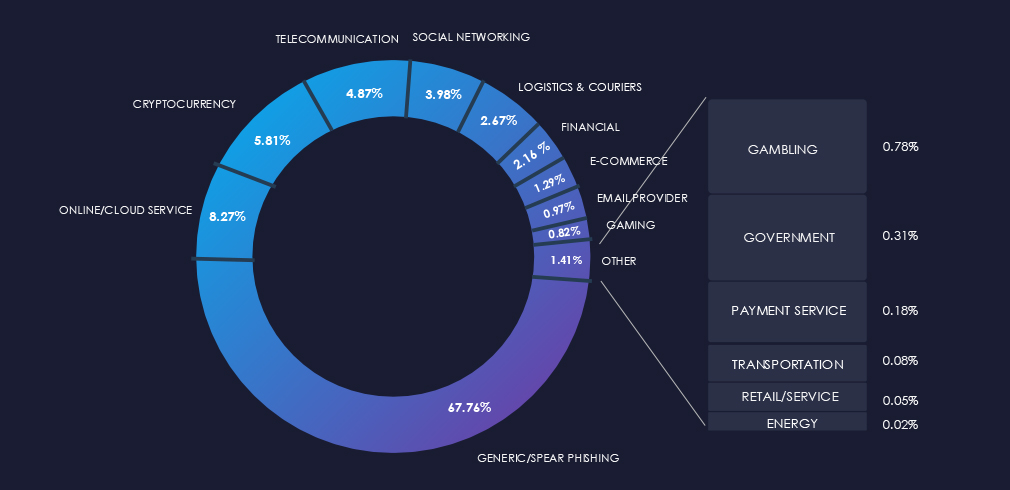
The chart below demonstrates the global distribution of observed themes. Energy themes comprise only 0.016% of all captured phishing.
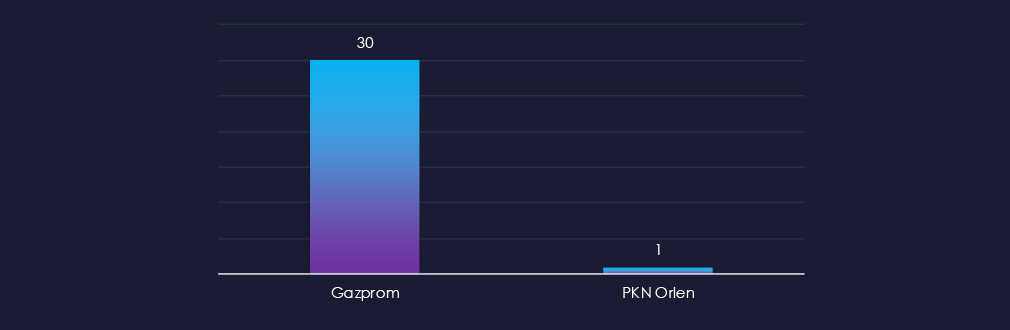
Only two brands have been impersonated; Russian natural gas giant Gazprom and Polish fuels conglomerate PKN Orlen.
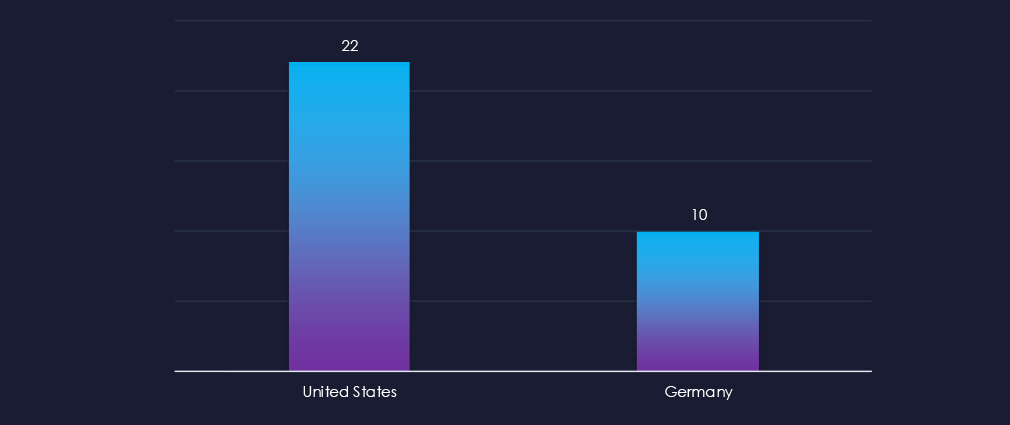
The US is a leading source of phishing globally, and despite neither brand operating in the US, phishing with their themes originates mostly from the US. The other observed source is Germany.

In total, energy & utilities comprise only 0.016% of all captured phishing in the last 90 days. This represents a decline from 0.032% in the previous 90-day period.
Only two impersonated brands were identified: Gazprom, a Russian natural gas giant, and PKN Orlen, a Polish fuels conglomerate.
Despite neither of these companies operating in the United States, the United States is the most frequent country of origin for energy and utilities phishing. Germany is the second most frequent country of origin.
Energy and utilities remain unpopular phishing themes. As previously discussed, the fragmented nature of the industry, with numerous companies involved in various regions, presents a challenge for widespread phishing. The theme is unlikely to align with the supplier or customer of the phishing message.
Conversely, there are other themes that are easier to execute and generate profits from.
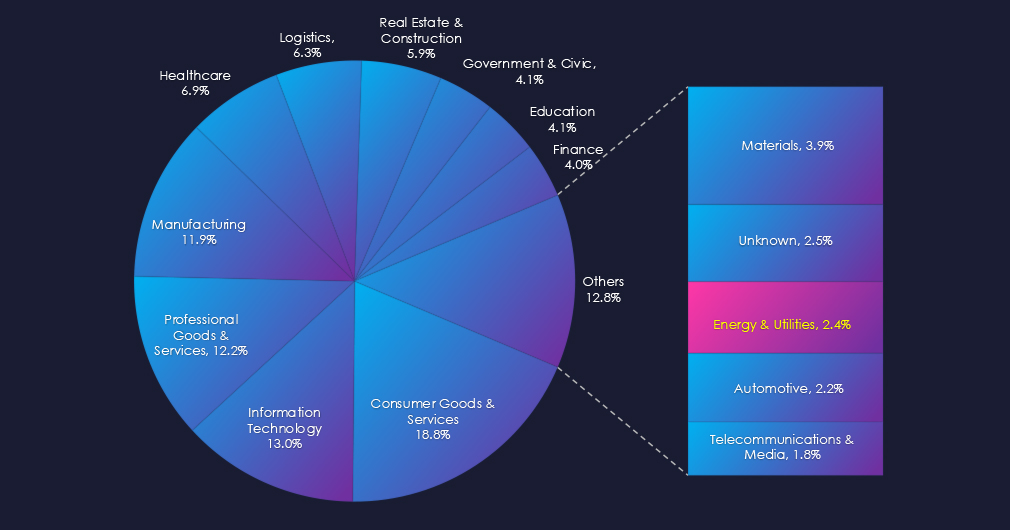
In the past 90 days, CYFIRMA has identified 47 verified ransomware victims in the energy & utilities industry. This accounts for 2.4% of the overall total of 1,987 ransomware victims during the same period, placing the energy & utilities industry as the 3rd least frequent victim of ransomware.
Furthermore, a quarterly comparison reveals sustained interest in the energy & utilities industry, with only a marginal increase of 6.8% from 44 to 47 victims. The overall share mildly declined from 2.8% to 2,4%.
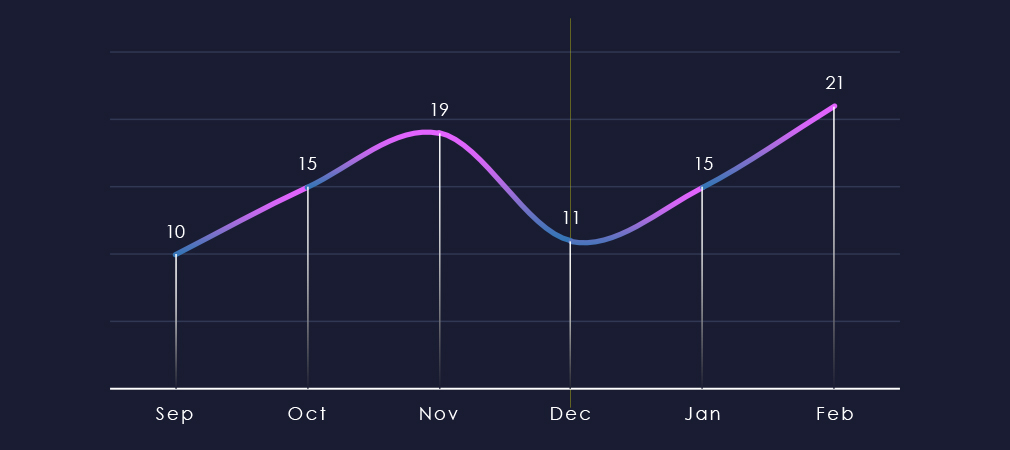
Over the past 180 days, we have observed a swinging number of victims month-over-month, peaking in November and then again in February.
We can attribute the December dip to an overall slump in ransomware activity. The dip is followed by a rebound to November highs.
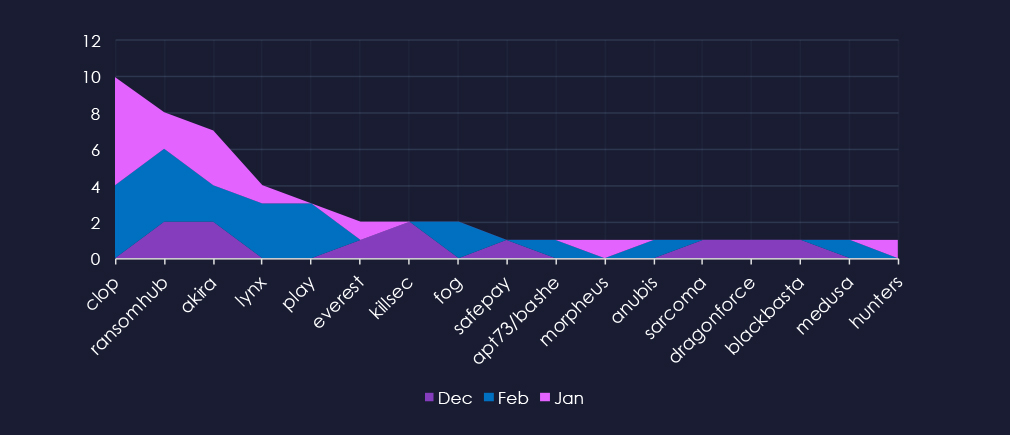
A breakdown of the monthly activity provides insights into which gangs were active each month. For example, the most active gang, Cl0p has no December victims and was very active in January and February. On the other hand, Killsec recorded all victims in December.
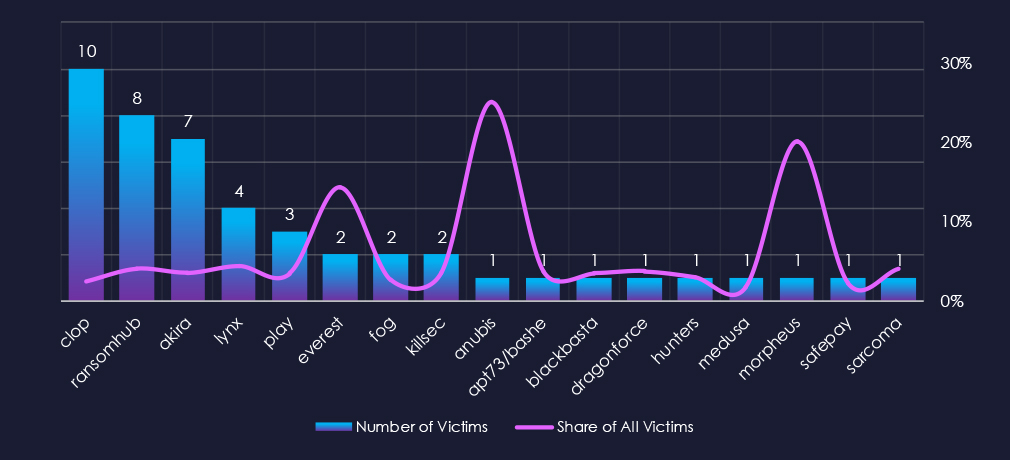
In total 17 out of 62 gangs were active in the last 90 days. Cl0p gang recorded the most victims (10), followed by RansomHub (8), and Akira(7). The share of all victims for the most active gangs in this industry is very low. Cl0p 2.5%, RansomHub 4.1%, and Akira 3.5%., suggesting energy & utilities are not their focus.
Everest recorded 2 out of 14 victims (14.3%) in this industry, suggesting a possible interest, but the overall numbers are too low for such a projection. Similarly, Morpheus and Anubis recorded 1 out of 5 and 4 victims respectively.
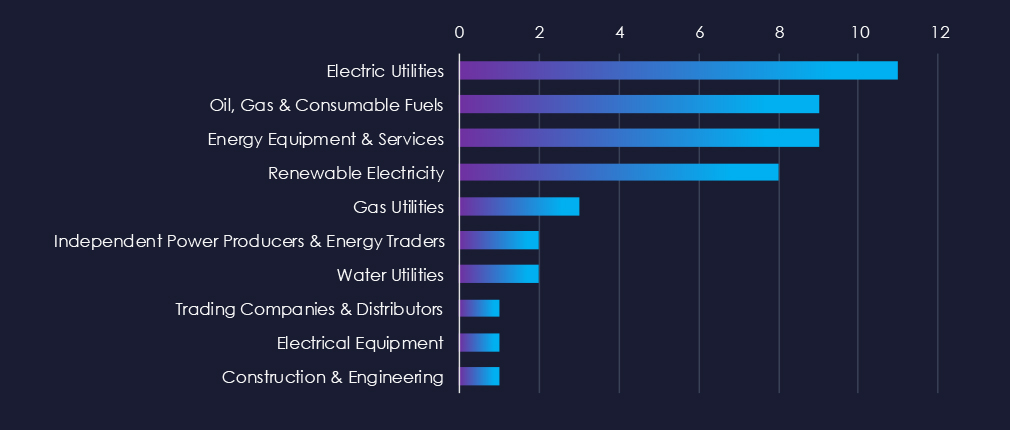
Electric Utilities, Oil, Gas & Fuels, and Energy Equipment & Services are the most frequent victims of ransomware in the energy & utilities industry.
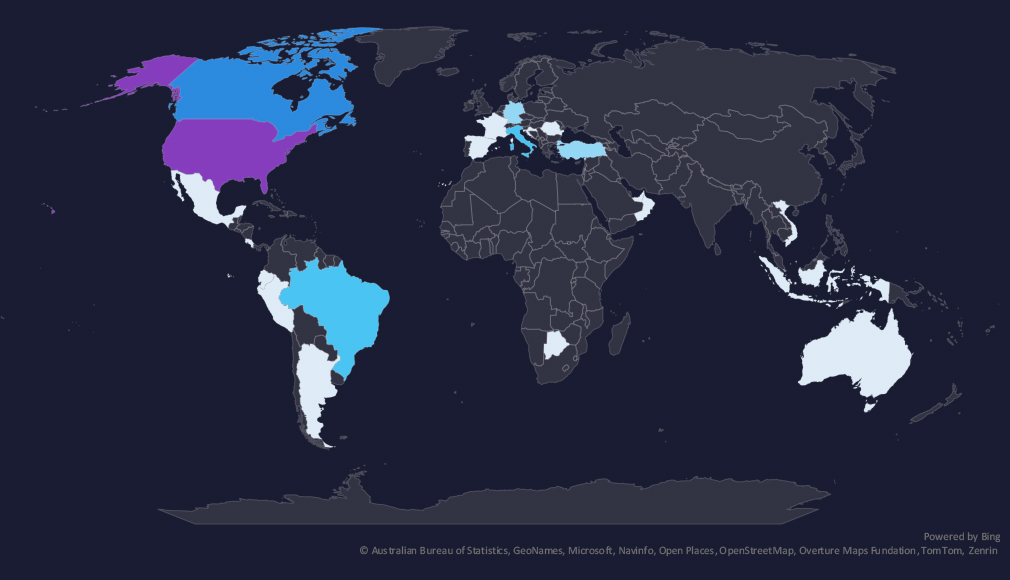
The geographic distribution heatmap underscores the widespread impact of ransomware, highlighting the countries where victims in this industry have been recorded. Notable is a growing presence in Latin America and Southeast Asia.
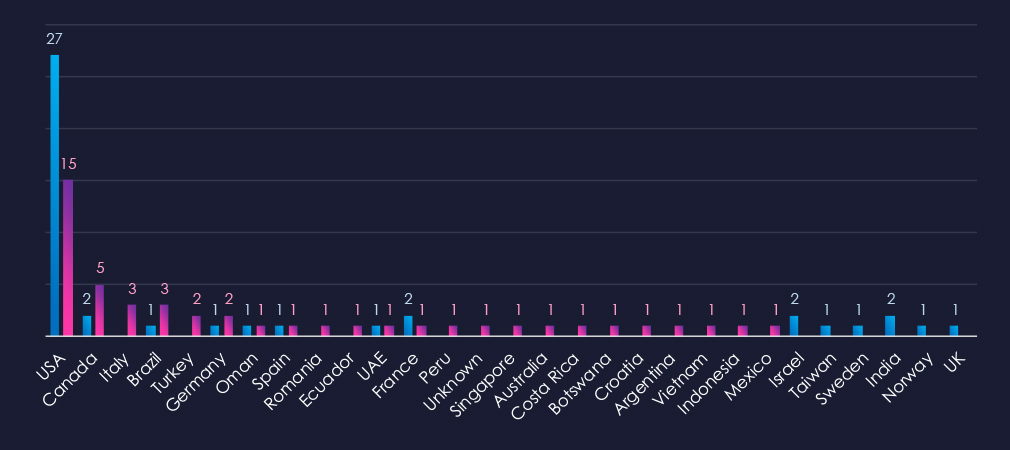
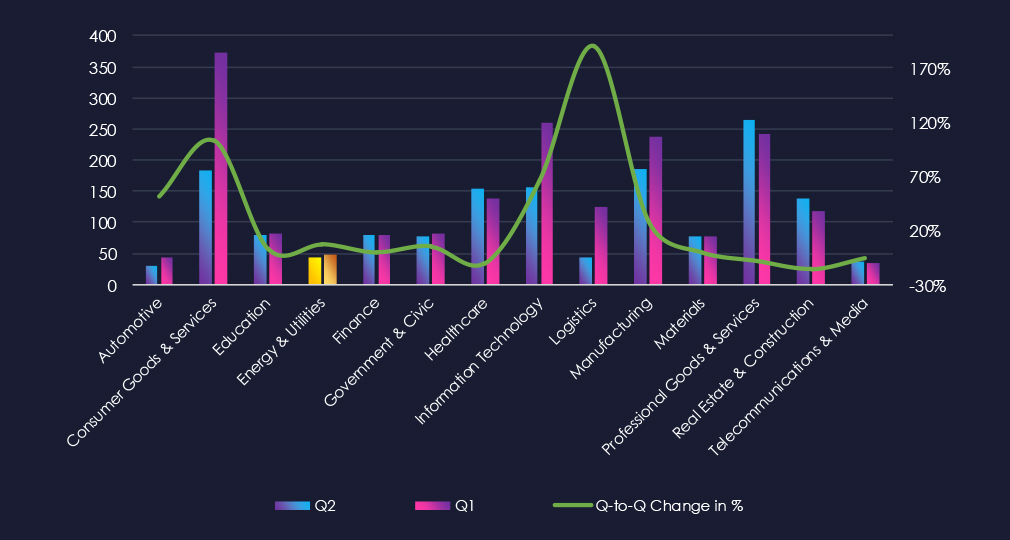
The chart shows quarter-to-quarter changes in the targeted countries. Data is sorted by last 90 days and compared to the previous 90 days marked in blue.
We can see a significant drop in USA victims and an increase in Canada, Italy, Brazil, and Turkey for example. Overall, there are more countries targeted compared to the previous period.

The energy & utilities industry is placed as the 3rd least frequent victim. It faces a sustained ransomware threat with only a minor increase of 6.8% quarter-to-quarter. However, the overall share dropped from 2.8% to 2.4% of all ransomware victims.
Monthly Activity Trends
Ransomware activity in the energy & utilities industry swung between months recording spikes in December and February.
Cl0p was the most active overall, followed by RansomHub and Akira
Ransomware Gangs
A total of 17 out of 62 active ransomware groups targeted this industry in the past 90 days:
Cl0p: The most active with 10 victims and 2.5% of their victims from the energy & utilities sectors (10 out of 400 victims).
Ransomhub: Second most active with 8 victims and a share of 4.1% victims in this industry (8 out of 197 victims).
Overall small participation and low shares of victims show low interest by ransomware groups in this industry.
Geographic Distribution
The geographic distribution of ransomware victims in the energy & utilities industry shows a developing trend. The number of victims in the USA significantly dropped and activity spread to more individual countries.
32% of all victims with identified geography are located in the US.
In total, 23 countries recorded ransomware victims in this industry in the last 90 days, which is an increase from 14 countries in the previous 90 days.
For a comprehensive, up-to-date global ransomware tracking report, please refer to our new monthly “Tracking Ransomware” series here.
Over the past 90 days, energy & utilities organizations faced low cyber risks:
APT Campaigns (Moderate): Only 17% of observed campaigns affected this sector, with a single December incident attributed to Chinese military-linked threat actors. Attacks spanned 11 countries, targeting web applications, operating systems, network monitoring tools, and routers.
Phishing (Low): Energy & utilities represented just 0.016% of captured phishing, down from 0.032%. Only Gazprom and PKN Orlen were impersonated. The U.S. was the top origin for energy phishing, followed by Germany, although neither brand primarily operates there. The fragmented industry structure continues to deter widespread phishing efforts.
Ransomware (Low): Ranked as the 3rd least frequent victim, the sector’s share declined from 2.8% to 2.4% of all ransomware incidents, despite a minor 6.8% quarterly increase. Of the 62 active groups, 17 targeted energy & utilities. Cl0p led with 10 victims (2.5% of its total), followed by RansomHub. While 32% of identified victims were in the U.S., attacks spread to 23 countries, up from 14 previously.