


The CYFIRMA Industry Report delivers original cybersecurity insights and telemetry-driven statistics of global industries, covering one sector each week for a quarter. This report focuses on the logistics industry, presenting key trends and statistics in an engaging infographic format.
Welcome to the CYFIRMA infographic industry report, where we delve into the external threat landscape of the logistics industry over the past three months. This report provides valuable insights and data-driven statistics, delivering a concise analysis of attack campaigns, phishing telemetry, and ransomware incidents targeting the logistics industry.
We aim to present an industry-specific overview in a convenient, engaging, and informative format. Leveraging our cutting-edge platform telemetry and the expertise of our analysts, we bring you actionable intelligence to stay ahead in the cybersecurity landscape.
CYFIRMA provides cyber threat intelligence and external threat landscape management platforms, DeCYFIR and DeTCT, which utilize artificial intelligence and machine learning to ingest and process relevant data, complemented by manual CTI research.
For the purpose of these reports, we leverage the following data from our platform. These are data processed by AI and ML automation based on both human research input and automated ingestions.
While this report contains statistics and graphs generated primarily by automation, it undergoes thorough review and enhancement for additional context by CYFIRMA CTI analysts to ensure the highest quality and provide valuable insights.
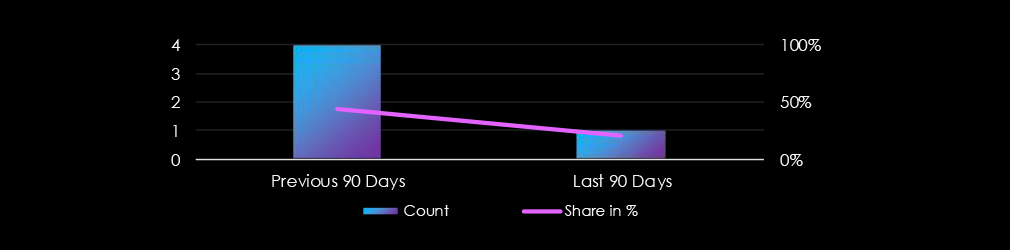
Logistics organizations did feature in 1 of the 5 observed campaigns, which is a presence in 20% of all campaigns. This is a drop from 4 in 9 campaigns and 44% presence in the previous 90-day period.

Observed campaigns are distributed intermittently and alternate between months.

The observed campaigns are attributed to Chinese threat actors Stone Panda. However, ransomware linked to TA505 is utilized, which muddies high-confidence attribution.
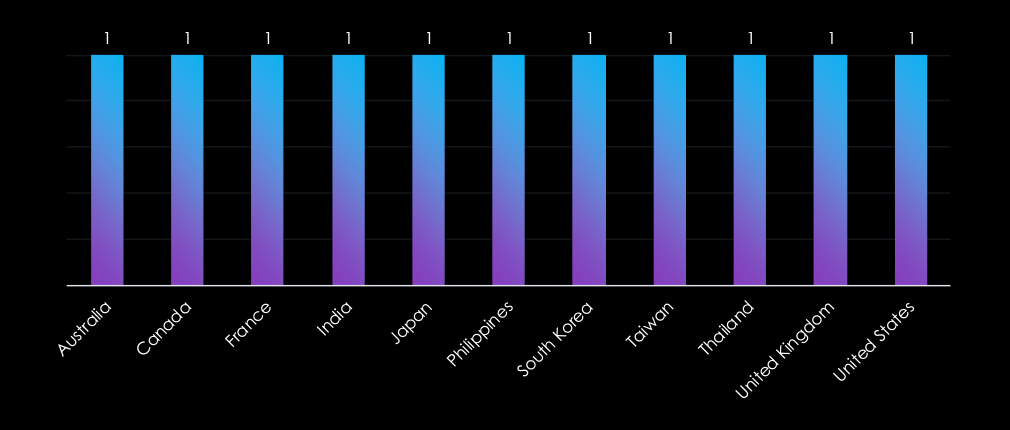
Victims of an observed attack campaign have been recorded in 11 different countries. Although there does not appear to be a discernible geographic pattern, upon closer examination, we can establish a link between the victims and the Chinese Communist Party’s sphere of influence.
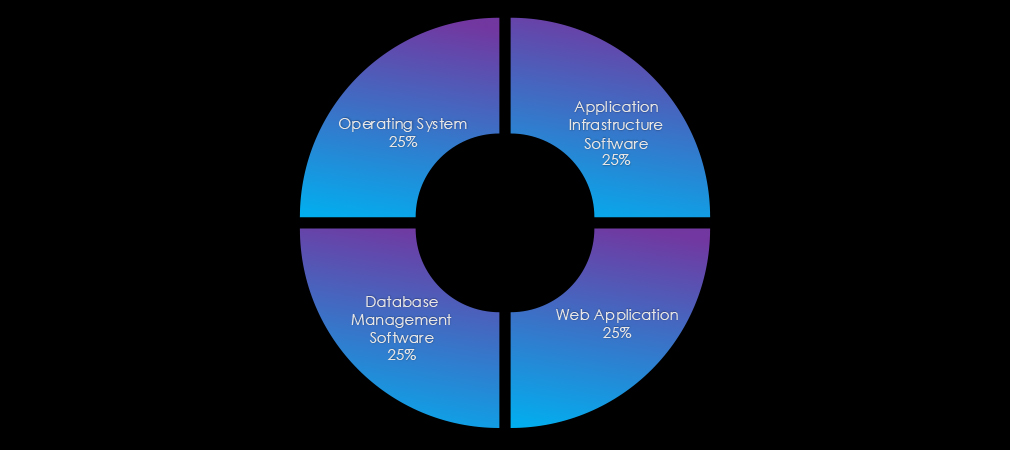
The observed campaigns targeted web applications, operating systems, database management software, and application infrastructure software.

In the past 90 days, logistics organizations have not been significantly affected by advanced persistent threat (APT) campaigns. Only 1 in 5 observed APT campaigns targeted the logistics industry, representing 20% presence.
This represents a significant decrease from the previous 90-day period when 4 out of 9 campaigns targeted the logistics industry.
Monthly Trends
The observed campaign occurred in March.
Key Threat Actors
The campaign is attributed to Chinese threat actors Stone Panda. However, the campaign involved ransomware linked to Russian TA505.
Geographical Impact
The campaigns have affected a total of 11 countries, seemingly distributed randomly across continents. While financial motivations are suspected, most countries are also of interest to the Chinese Communist Party (CCP).
Targeted Technologies
Web applications remain the most frequently targeted technology. Additionally, database management and application infrastructure software have been compromised.
Over the past three months, CYFIRMA’s telemetry has identified 1,383 mentions of the logistics Industry out of a total of 53,681 industry mentions. This is from a total of 500,247 posts across various underground and dark web channels and forums.
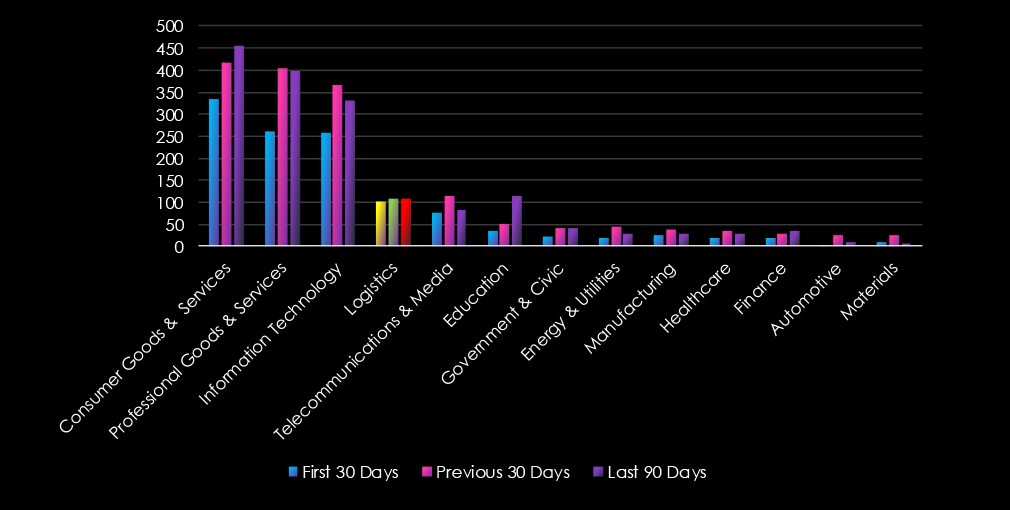
Logistics Industry ranked as 3rd least frequently mentioned industry in the last 90 days with a share of 2.6% of all detected industry chatter.
Below is a breakdown of 30-day periods of all mentions.
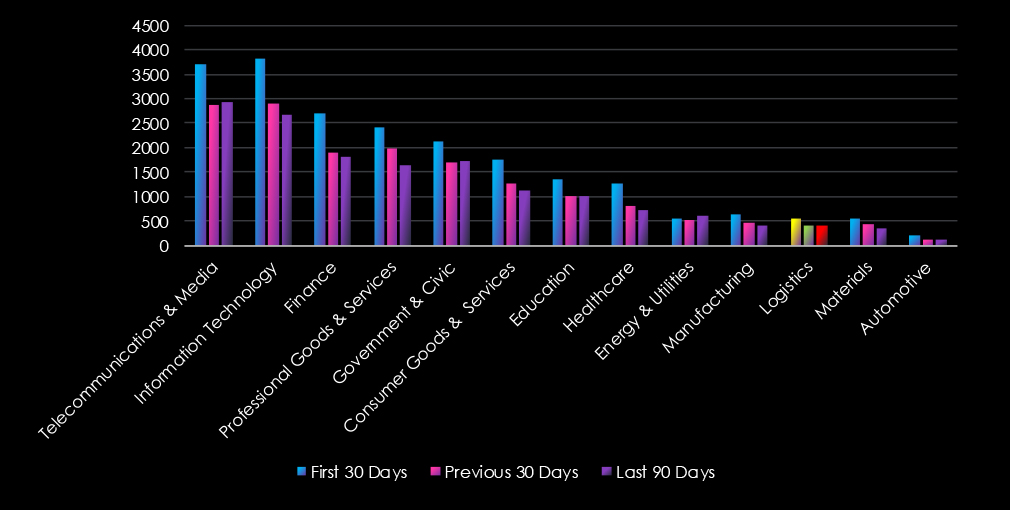
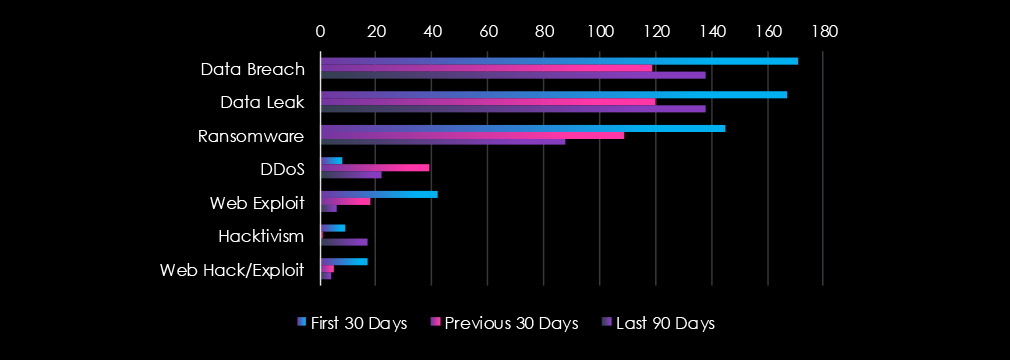
Data breaches, data leaks, and ransomware were the top three categories of recorded cyber threats for the logistics industry. Notably, there was a significant dip in activity followed by a rebound over the three 30-day periods.

In total, logistics comprise 2.6% of all detected industry underground and dark web chatter in the last 90 days, ranking as the 3rd least frequently mentioned industry.
Below are observed key trends across 90 days.
Steady Increase in Mentions (+35%)
413 (Jan) → 411 (Feb) → 559 (Mar)
Top Threats (March 2025)
Data Breach: 171 (+24%)
Data Leak: 167 (+21%)
Ransomware: 145 (+64%)
Surge in Web Exploits
6 (Jan) → 18 (Feb) → 42 (Mar) (+600%)
DDoS Activity Declining
22 (Jan) → 39 (Feb) → 8 (Mar)
Hacktivism is Unstable but Present
17 (Jan) → 1 (Feb) → 9 (Mar)
Spikes may be linked to specific events.
Over the past three months, CYFIRMA’s telemetry has identified 316 mentions of logistics out of a total of 4,542 industry mentions. This is from a total of 10,497 CVEs published in 90 days.
Logistics ranked as 4th most frequently mentioned industry in the last 90 days with a share of 6.96% of all detected industry chatter.
Below is a breakdown of 30-day periods of all mentions.
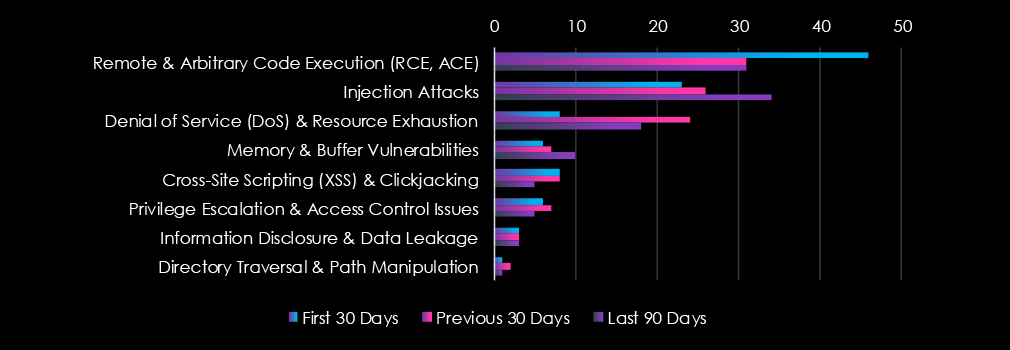
Remote & Arbitrary Code Execution, Injection Attacks, Denial of Service (DoS) & Resource Exhaustion were the top 3 vulnerabilities mentioned in the context of the logistics industry.

In total, logistics comprise 6.96% of all detected industry vulnerabilities in the last 90 days, ranking as the 4th most frequently mentioned industry.
Below are observed key trends across 90 days.
Stable CVE Mentions Over Time
101 (Jan) → 108 (Feb) → 107 (Mar)
No major fluctuations, but vulnerabilities remain a persistent issue.
Top Vulnerability Types (March 2025)
Injection Attacks: 34 (+48%)
Memory & Buffer Vulnerabilities: 10 (+67%)
Remote Code Execution (RCE): 31 (unchanged from Feb)
Injection Attacks on the Rise
23 (Jan) → 26 (Feb) → 34 (Mar) (+48%)
Decrease in Denial of Service (DoS) Attacks
8 (Jan) → 24 (Feb) → 18 (Mar) → Peak in February, but now declining.
Privilege Escalation Risks Remain
6 (Jan) → 7 (Feb) → 5 (Mar)
In the past 90 days, CYFIRMA has identified 129 verified ransomware victims in the logistics industry. This accounts for 6.5% of the overall total of 1,984 ransomware victims during the same period, placing the logistics industry as the 6th most frequent victim of ransomware.
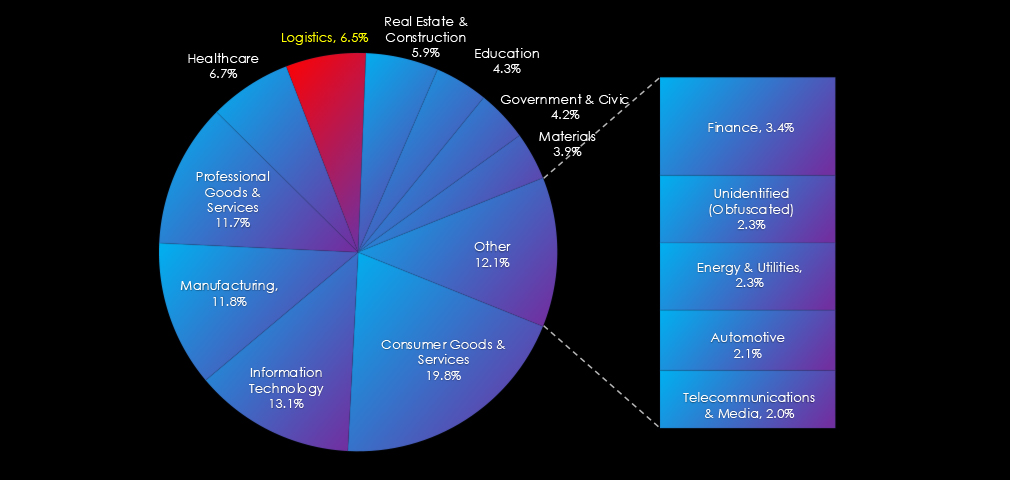
Furthermore, a quarterly comparison reveals significant increase of interest in logistics industry of 174.5% from 47 to 129 victims. The overall share increased from 2.8% to 6.5%.
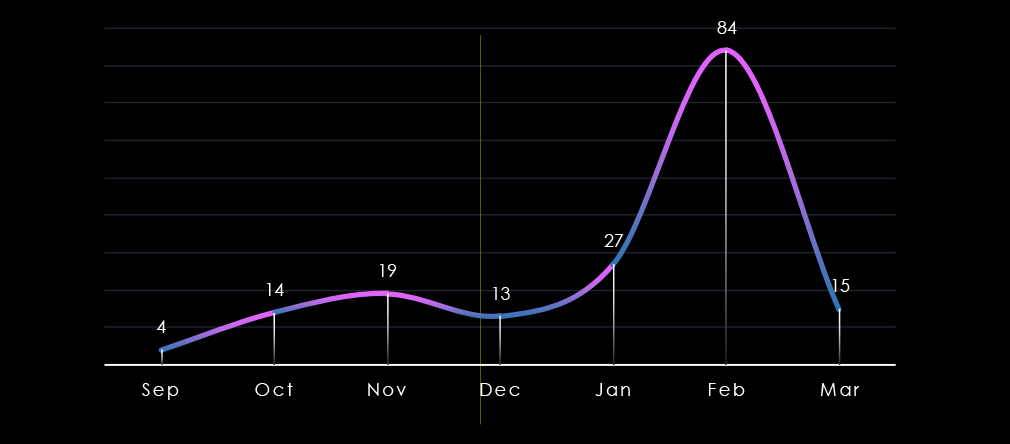
Over the past 180 days, we have observed relatively low numbers of victims month-over-month, with a huge spike in activity in February.
As per the chart below, the February spike is due to the Cl0p ransomware rampage.
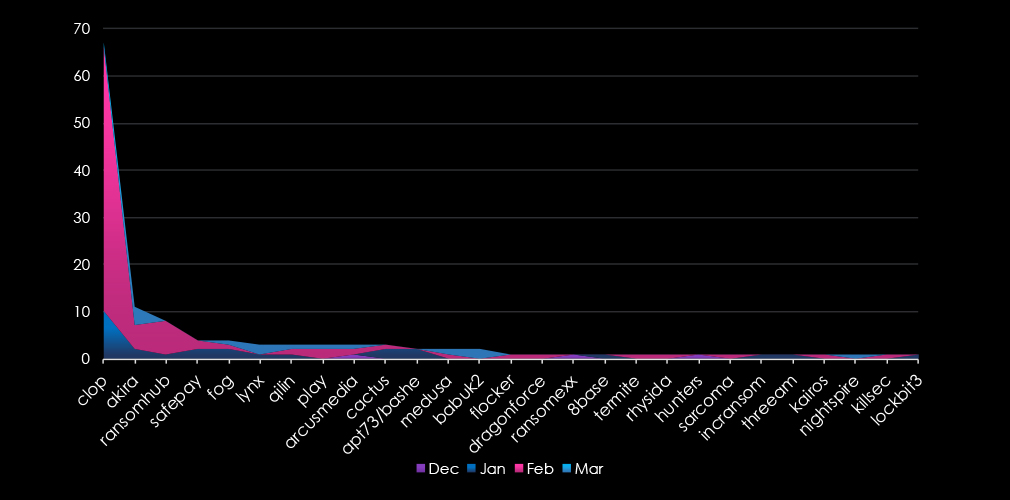
A breakdown of the monthly activity provides insights into which gangs were active each month. For example, the most active gang Cl0p has recorded most victims in February. On the other hand Lynx recorded all victims in March.
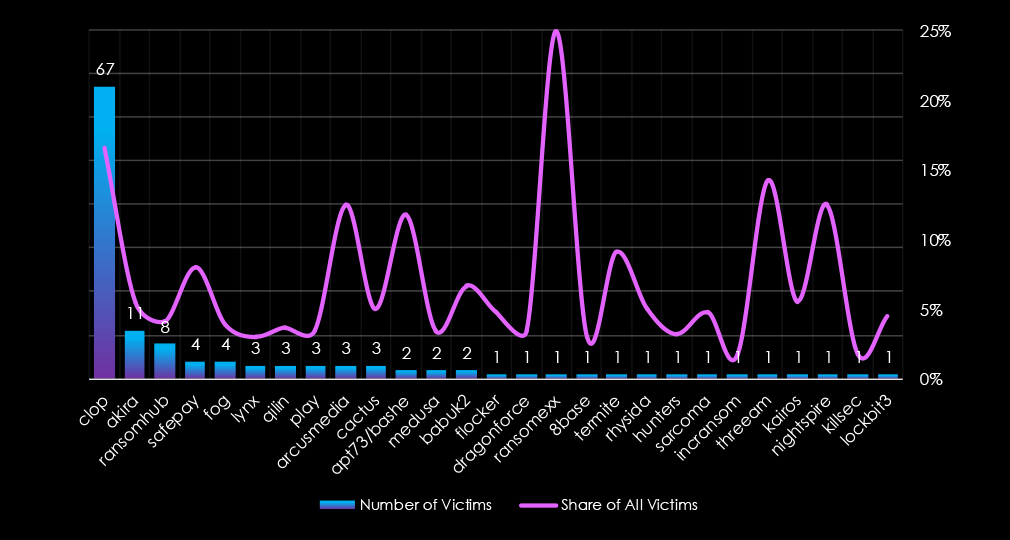
In total 27 out of 63 gangs were active in the last 90 days. Clop gang recorded the most victims (67), followed by Akira (11) and RansomHub (8).
The share of all victims for most gangs in this industry is relatively low, with the exception of Cl0p at 16.6%, followed by Arcusmedia at 12.5% and APT73/Bashe at 11.8%, suggesting the Logistics Industry is their focus.
Out of the top 10 gangs, only two have more than a single-digit percentage.
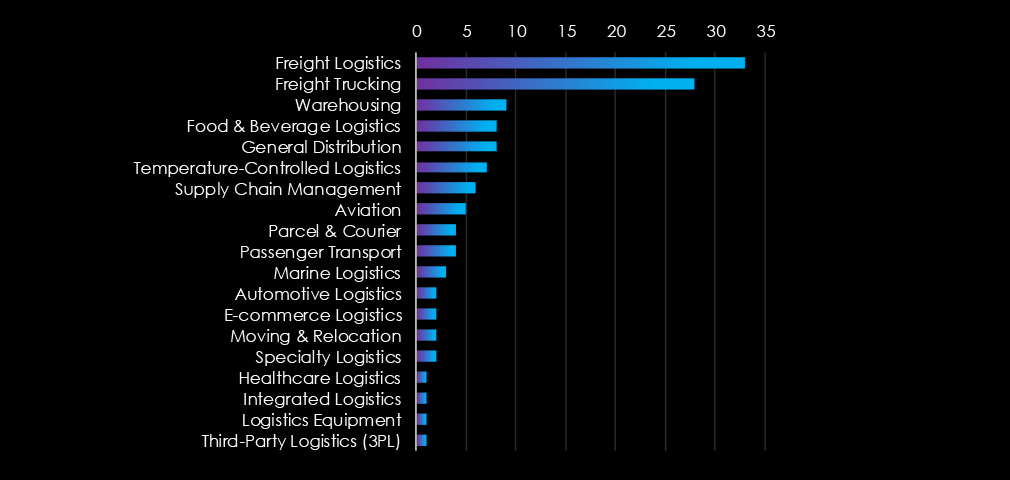
Freight Logistics, Freight Trucking, and Warehousing are the most frequent logistics victims of ransomware.
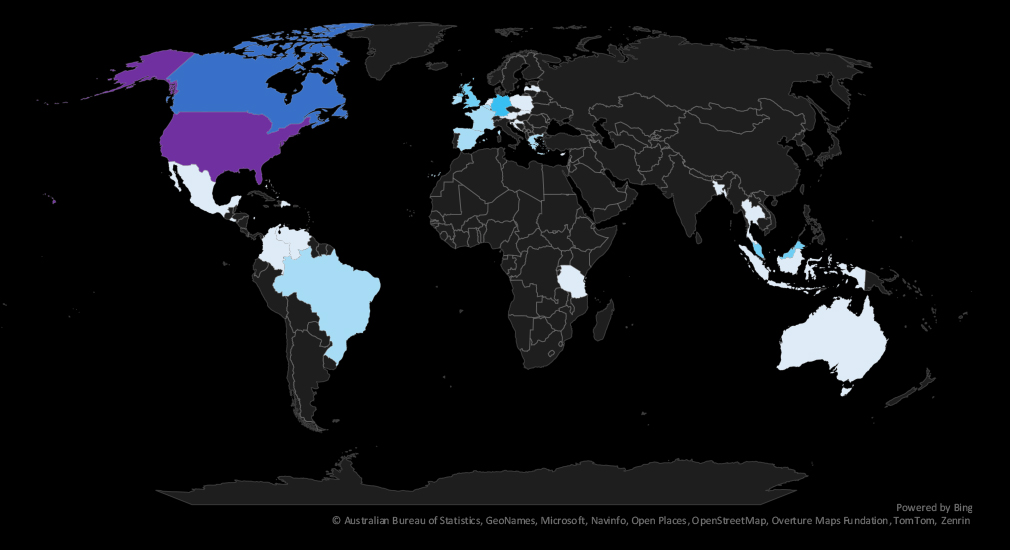
The geographic distribution heatmap underscores the widespread impact of ransomware, highlighting the countries where victims in this industry have been recorded. Notable is its growing presence in Latin America and India
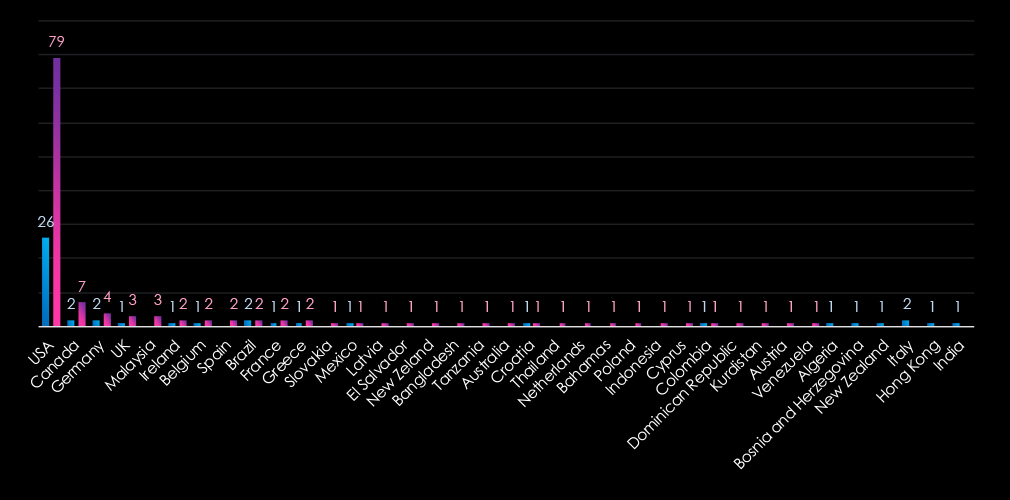
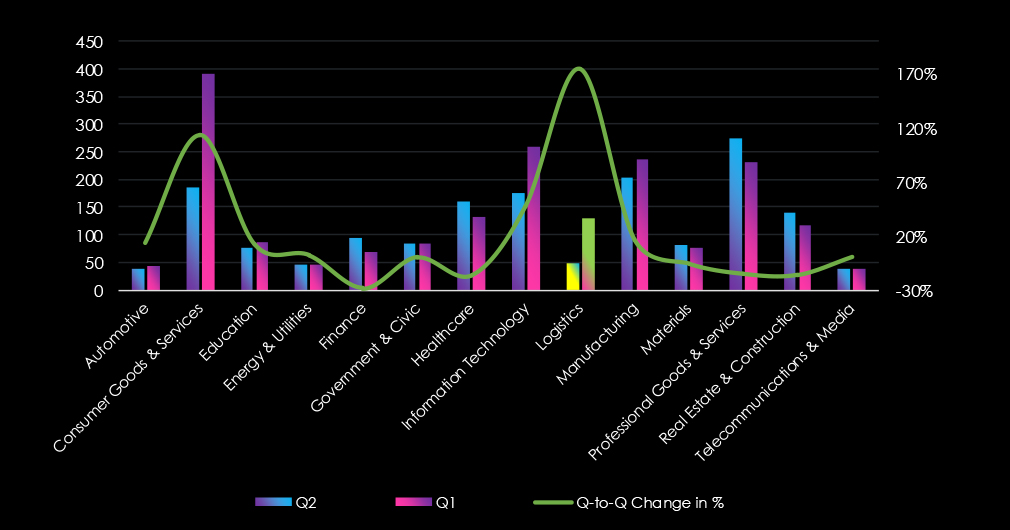
The chart shows quarter-to-quarter changes in targeted countries. Data is sorted by last 90 days and compared to the previous 90 days marked blue.
We can see the USA dominating the logistics ransomware victimology as it was the most attacked country by the Cl0p ransomware rampage.

The logistics industry is placed as the 6th most frequent victim. It faced an elevated ransomware threat in February due to the Cl0p gang rampage causing an increase of 175% quarter-to-quarter. Overall share also increased from 2.8% to 6.5% of all ransomware victims
.Most countries are facing low risk except the USA, where the risk factor is elevated due to the focus on Cl0p ransomware.
Monthly Activity Trends
Ransomware activity in the logistics industry was generally low with a huge spike during February.
Cl0p was the most active overall followed by Akira and RansomHub.
Ransomware Gangs
A total of 27 out of 63 active ransomware groups targeted this industry in the past 90 days:
Cl0p: The most active with 67 victims and 16.6% of their victims from the logistics sectors (67 out of 403 victims).
Akira: Second most active with a share of only 5.5% of victims in this industry (11 out of 201 victims). Present a risk due to high activity.
Overall 2 out of the top 10 gangs recorded a 10%+ share of their victims in logistics, implying higher focus.
Geographic Distribution
The geographic distribution of ransomware victims in the logistics industry is dominated by the USA (79) accounting for 61% of all victims. Canada, Germany, the UK, and Malaysia are in the top 5 most attacked countries.
In total, 32 countries recorded ransomware victims in this industry in the last 90 days, which is an increase from 18 countries in the previous 90 days.
For a comprehensive, up-to-date global ransomware tracking report, please refer to our new monthly “Tracking Ransomware” series here.
Over the past 90 days, logistics organizations experienced relatively low cyber risks from APT campaigns and dark web chatter, a moderate risk from vulnerabilities, and an elevated yet still “low” level of ransomware activity:
APT Campaigns: Only 20% of observed campaigns targeted logistics—down from 44% last quarter. One campaign in March involved Chinese group Stone Panda and Russian TA505. Attacks spanned 11 countries, focusing on web applications, database systems, and application infrastructure.
Underground & Dark Web Chatter: Accounting for 2.6% of detected chatter, logistics ranked as the 3rd least mentioned industry. Nonetheless, chatter rose by 35%, with data breaches, data leaks, and ransomware as top concerns and a notable surge in web exploit mentions.
Vulnerabilities: Representing 6.96% of recorded vulnerabilities, logistics ranked 4th overall. While total CVE counts remained stable, injection attacks, memory/buffer flaws, and remote code execution vulnerabilities showed upward trends, underscoring the need for consistent patch management.
Ransomware: Though nominally low, the sector’s share of total ransomware victims increased from 2.8% to 6.5%. Cl0p’s February “rampage” drove a 175% quarter-over-quarter spike, making logistics the 6th most targeted industry. Of 63 active groups, 27 targeted logistics; the U.S. dominated victim geography with 61% of identified cases, followed by Canada, Germany, the U.K., and Malaysia. A total of 32 countries reported ransomware attacks against logistics, up from 18 previously.