


The CYFIRMA Industry Report delivers original cybersecurity insights and telemetry-driven statistics of global industries, covering one sector each week for a quarter. This report focuses on the materials industry, presenting key trends and statistics in an engaging infographic format.
Welcome to the CYFIRMA infographic industry report, where we delve into the external threat landscape of the materials industry over the past three months. This report provides valuable insights and data-driven statistics, delivering a concise analysis of attack campaigns, phishing telemetry, and ransomware incidents targeting the materials industry.
We aim to present an industry-specific overview in a convenient, engaging, and informative format. Leveraging our cutting-edge platform telemetry and the expertise of our analysts, we bring you actionable intelligence to stay ahead in the cybersecurity landscape.
CYFIRMA provides cyber threat intelligence and external threat landscape management platforms, DeCYFIR and DeTCT, which utilize artificial intelligence and machine learning to ingest and process relevant data, complemented by manual CTI research.
For the purpose of these reports, we leverage the following data from our platform. These are data processed by AI and ML automation based on both human research input and automated ingestions.
While this report contains statistics and graphs generated primarily by automation, it undergoes thorough review and enhancement for additional context by CYFIRMA CTI analysts to ensure the highest quality and provide valuable insights.
Materials organizations did feature in 1 of the 5 observed campaigns, which is a presence in 20% of all campaigns, same as in the previous 90-day period, however with an increase in the overall share from a 17% presence.
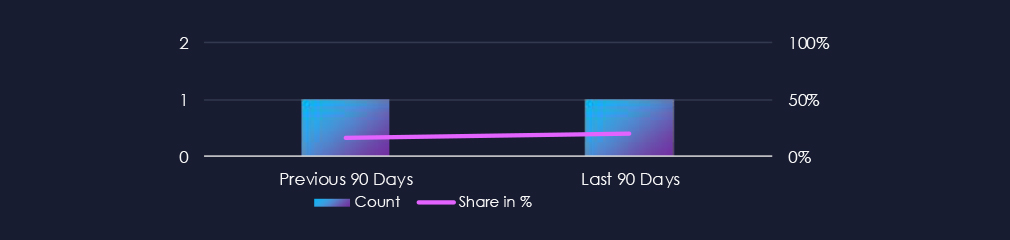
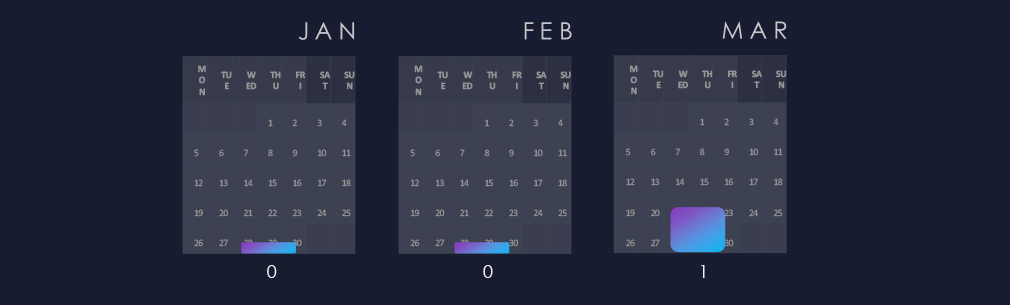
A single APT campaign with materials industry victims was observed in March.
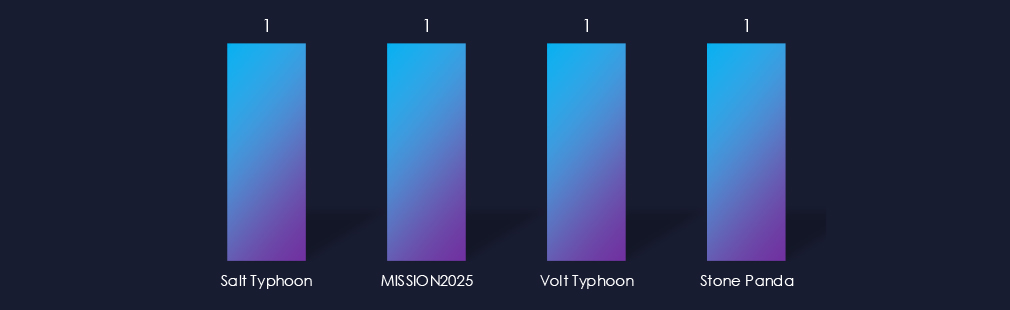
The observed campaign is attributed to multiple Chinese threat actors. We observe overlapping TTP between older naming conventions (Stone Panda, MISSION2025) and new tool-based Typhoon names. We hypothesize these are most likely the same or re-organized nation-state teams.
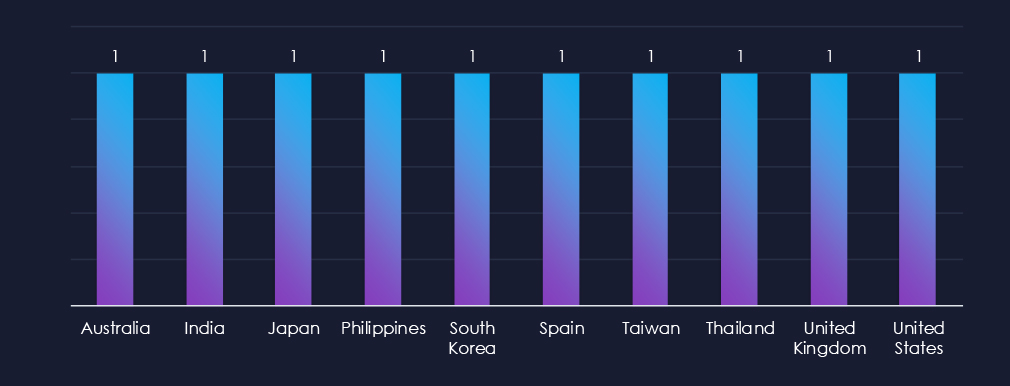
Victims of an observed attack campaign have been recorded in 10 different countries. Between Asia, NATO with QUAD alliances countries are of geopolitical interest to the Chinese government.
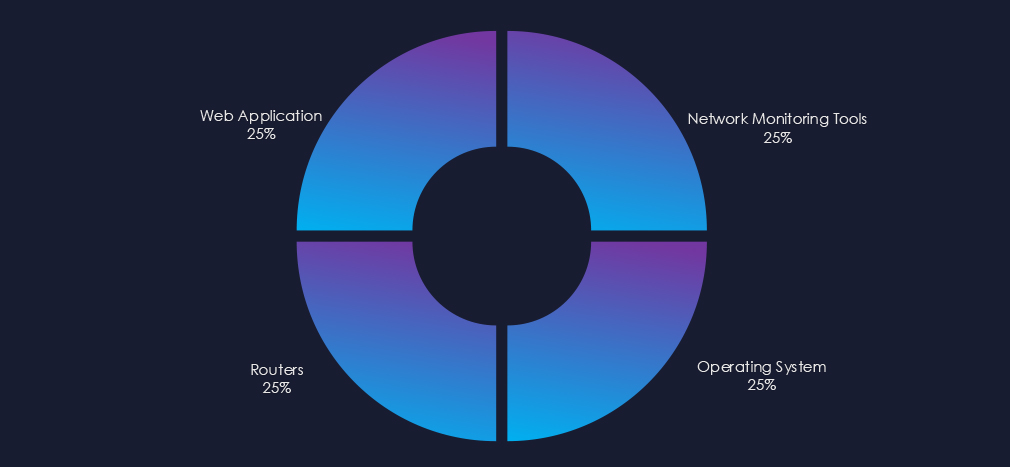
Observed campaign targeted web applications, operating systems, routers and network monitoring tools.
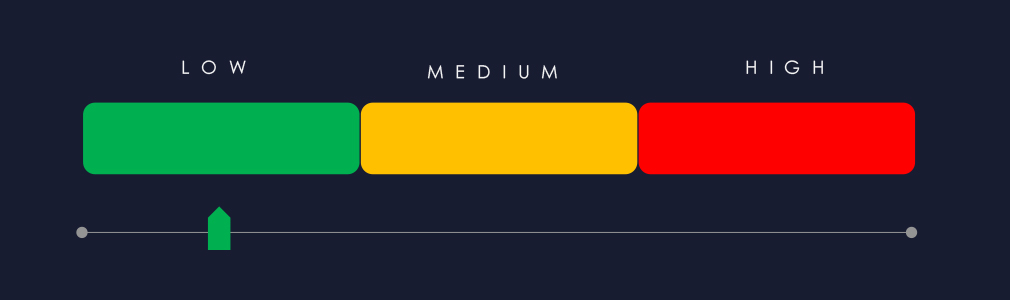
In the past 90 days, materials organizations have not been significantly affected by advanced persistent threat (APT) campaigns. 1 in 5 observed APT campaigns targeted the materials industry, representing 20% presence.
This is the same as the previous 90-day period when 1 out of 6 campaigns targeted the materials industry.
Monthly Trends
The observed campaign occurred in March.
Key Threat Actors
The campaigns are attributed to Chinese threat actors Salt Typhoon and Volt Typhoon.
Geographical Impact
The campaigns have affected a total of 10 countries, seemingly distributed randomly across continents. However, most countries are also of interest to the Chinese Communist Party (CCP).
Targeted Technologies
Web applications and operating systems remain the most frequently targeted technology. Additionally, routers and network monitoring tools have been compromised.
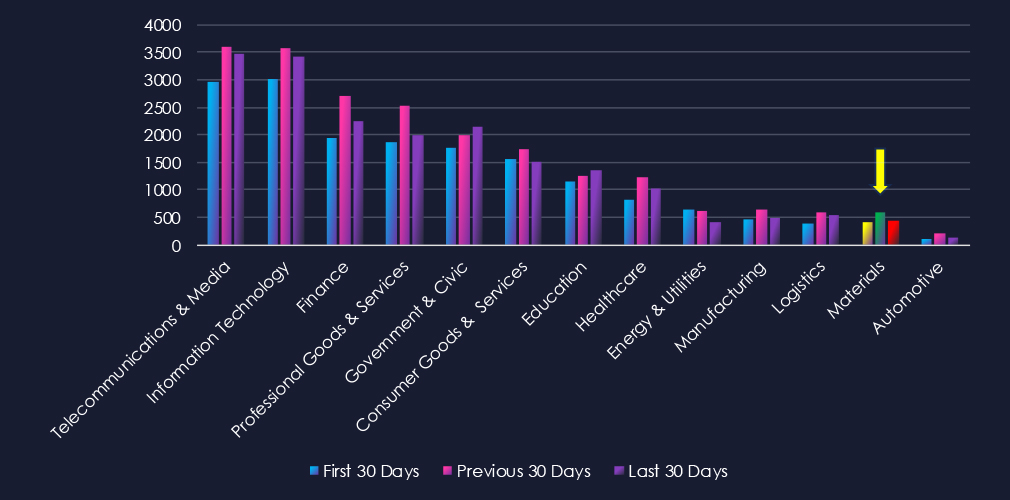
Over the past three months, CYFIRMA’s telemetry has identified 1,445 mentions of the materials industry out of a total of 57,493 industry mentions. This is from a total of 528,641 posts across various underground and dark web channels and forums.
Materials ranked 12th out of 13 industries in the last 90 days with a share of 2.51% of all detected industry chatter.
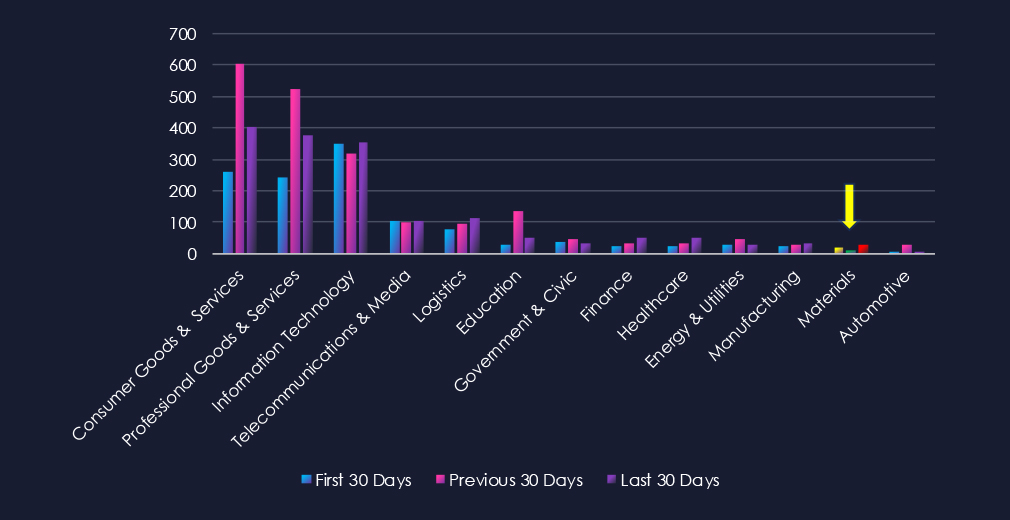
Below is a breakdown of 30-day periods of all mentions.
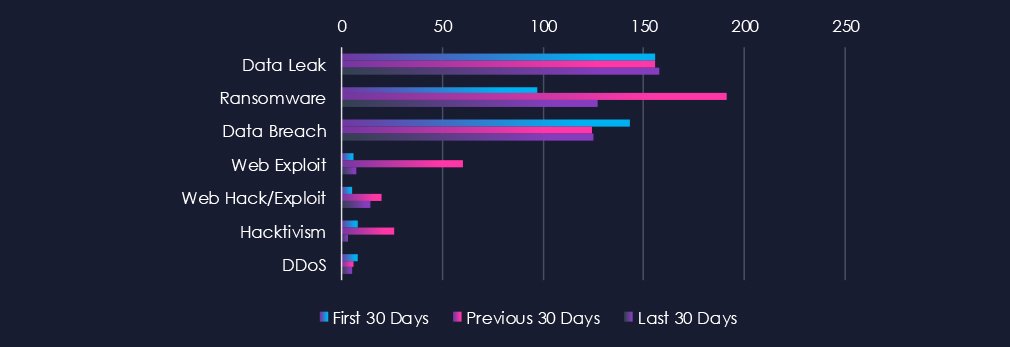
Data leaks, ransomware, and data breaches were the top three categories of recorded cyber threats for the materials industry.

In total, materials comprise 2.51% of all detected industry underground and dark web chatter in the last 90 days, ranking 12th out of 13 industries.
Below are observed key trends across 90 days.
Overall Trend: Spike Then Decline
First 30 Days: 423
Previous 30 Days: 583 (↑38%)
Last 30 Days: 439 (↓25%)
Activity surged in the middle period, then dropped but remained above initial levels.
Top Threats (Last 30 Days)
Ransomware: 127 (↓33% from previous)
Data Leak: 158 (stable across all periods)
Data Breach: 125 (slightly down from Jan, stable overall)
Web Exploits Dropped Sharply
60 (Previous) → 7 (Last) (↓88%)
Hacktivism Plummeted
26 (Previous) → 3 (Last)
Web Hack/Exploit Activity Still Elevated
5 → 20 → 14
Though lower than the previous peak, it’s still nearly triple the baseline from the first 30 days.
Over the past three months, CYFIRMA’s telemetry has identified 58 mentions of the materials industry out of a total of 4,833 industry mentions. This is from a total of 11,474 CVEs published in 90 days.
The materials industry ranked 12th out of 13 industries in the last 90 days with a share of 1.19% of all detected industry chatter.
Below is a breakdown of 30-day periods of all mentions.
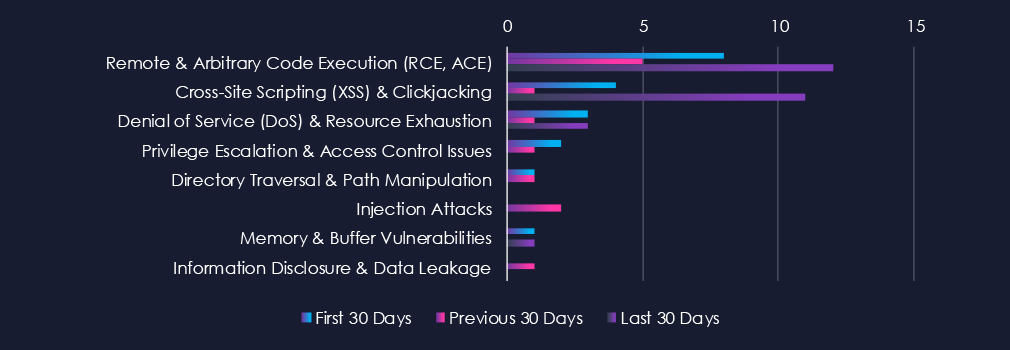
Remote & Arbitrary Code Execution are the most common vulnerabilities along with Cross-Site Scripting (XSS) & Clickjacking. They both recorded notable increases in the last 90-day period.

In total, materials comprise 1.19% of all detected industry vulnerabilities in the last 90 days, ranking as 12th out of 13 industries.
Below are observed key trends across 90 days.
Overall Trend: Rebound in March
First 30 Days: Moderate activity
Previous 30 Days: Decline across most categories
Last 30 Days: Noticeable resurgence in key vulnerabilities like RCE and XSS
Top Vulnerabilities (Last 30 Days)
Remote Code Execution (RCE): 12 (↑140% from previous)
Cross-Site Scripting (XSS): 11 (↑1000%)
Both categories saw major spikes, signaling renewed targeting of externally exposed systems.
Stable/Low Threats
Denial of Service: 3 (returning to Jan levels)
Memory/Buffer Vulnerabilities: 1 (low but consistent)
Privilege Escalation, Injection, Directory Traversal: 0 in March
Disappearing Threats
Privilege Escalation & Injection Attacks were present earlier but disappeared in March
Suggests either improved mitigation or attacker shift in focus
In the past 90 days, CYFIRMA has identified 90 verified ransomware victims in the materials industry. This accounts for 4.10% of the overall total of 2,194 ransomware victims during the same period, placing the materials industry 10th out of 14 industries.
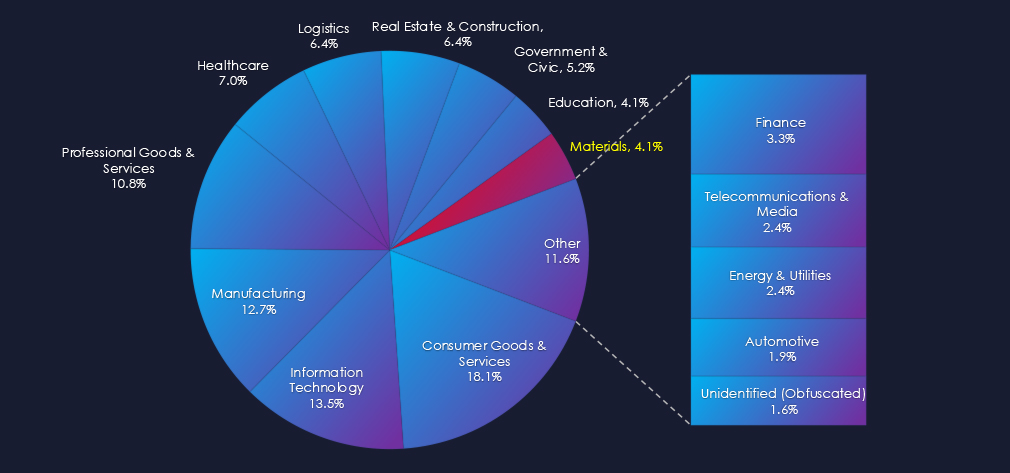
Furthermore, a quarterly comparison reveals a mild increase of interest in materials industry of 15.4% from 78 to 90 victims. However, the overall share decreased from 4.8% to 4.1%.
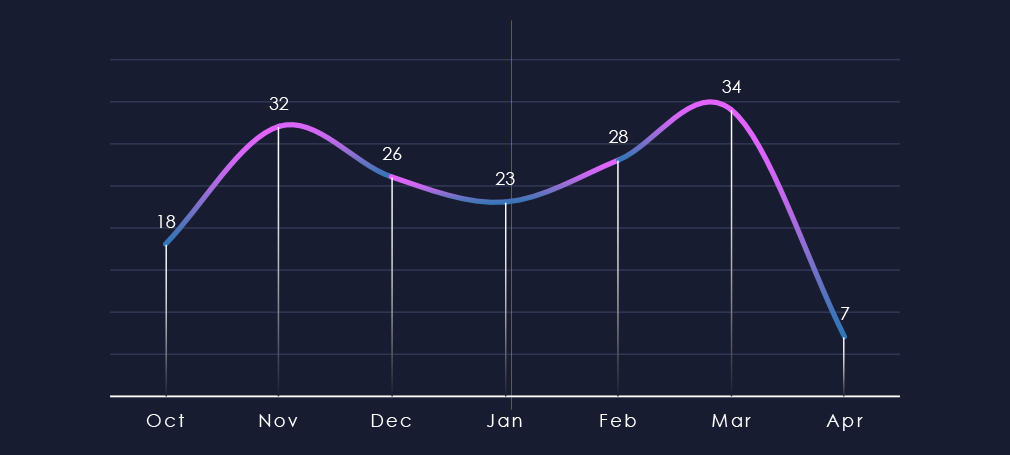
Over the past 180 days, we have observed sustained activity across months with mild spikes during November and March.
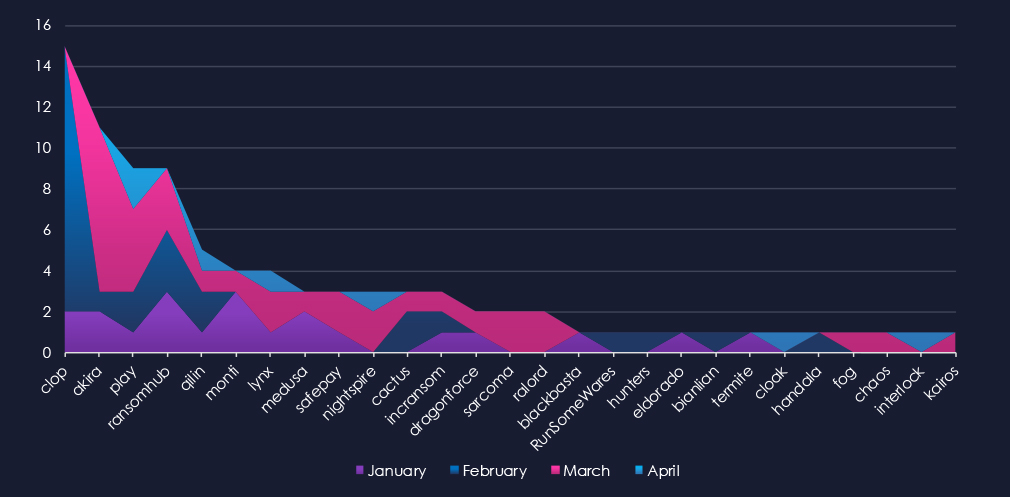
A breakdown of the monthly activity per gang provides insights into which gangs were active each month. For example, the most active gang Cl0p recorded nearly all victims in February. On the other hand, Akira in March and the RansomHub gang was active across all three months.
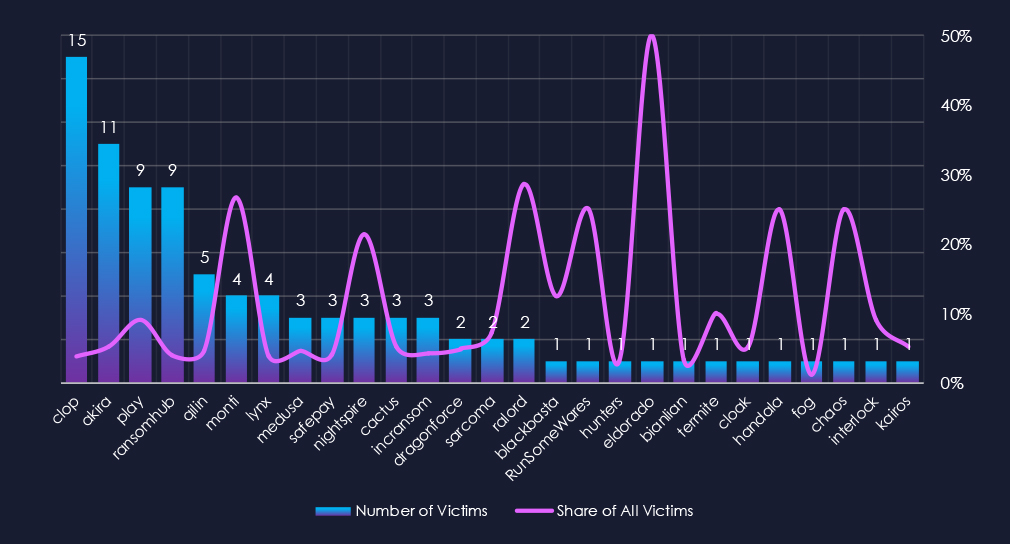
In total 27 out of 69 gangs were active in the last 90 days. Cl0p gang recorded the most victims (15), followed by Akira (11) and Play with RansomHub (9).
The share of all victims for most gangs in this industry is relatively low. Out of the top 10 gangs only two have above 10% share of victims in materials.
Notable are Play (9.1% – 9 out of 99), Monti (26.7% – 4 out of 15), and Nightspire (21.4% – 3 out of 14) suggesting a high focus on this industry.
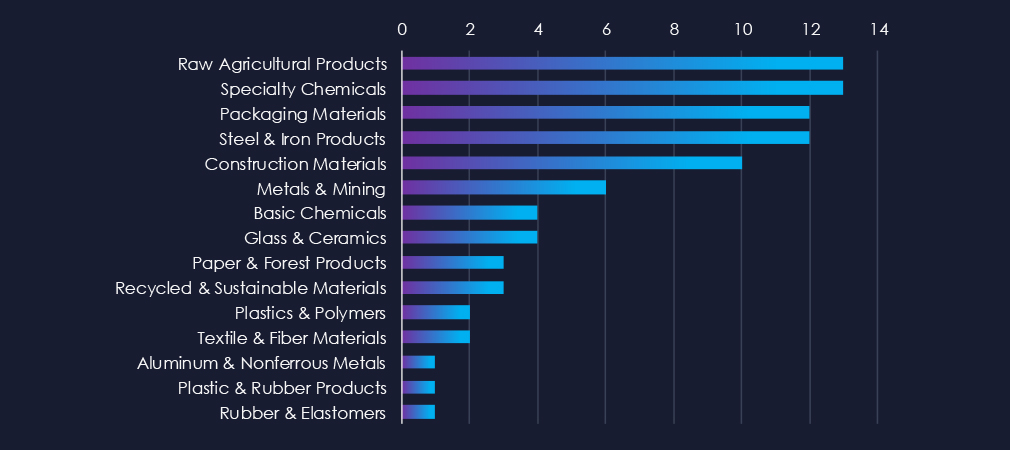
Raw agricultural products, specialty chemicals, packaging materials, and steel & iron are the most frequent victims in the materials industry.
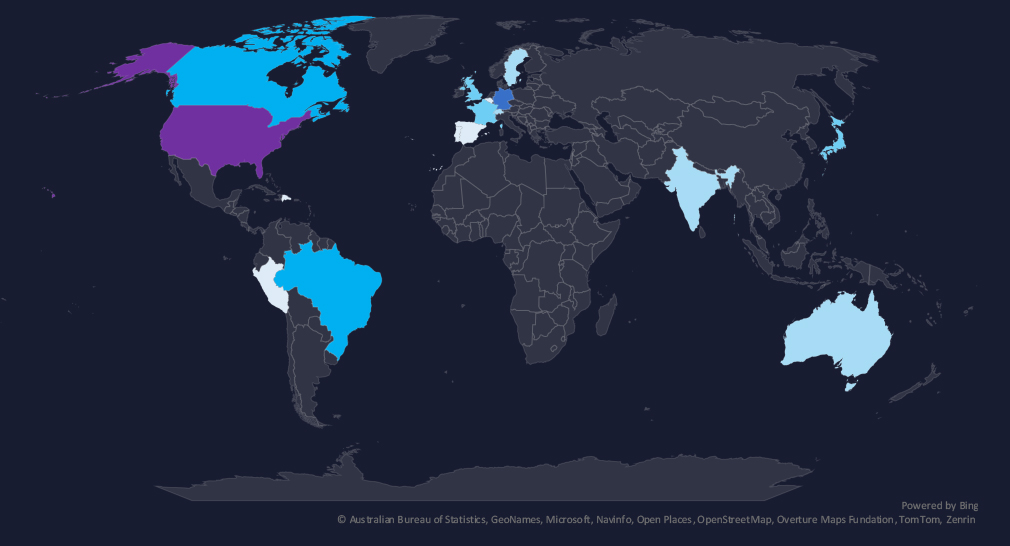
The geographic distribution heatmap underscores the widespread impact of ransomware, highlighting the countries where victims in this industry have been recorded.
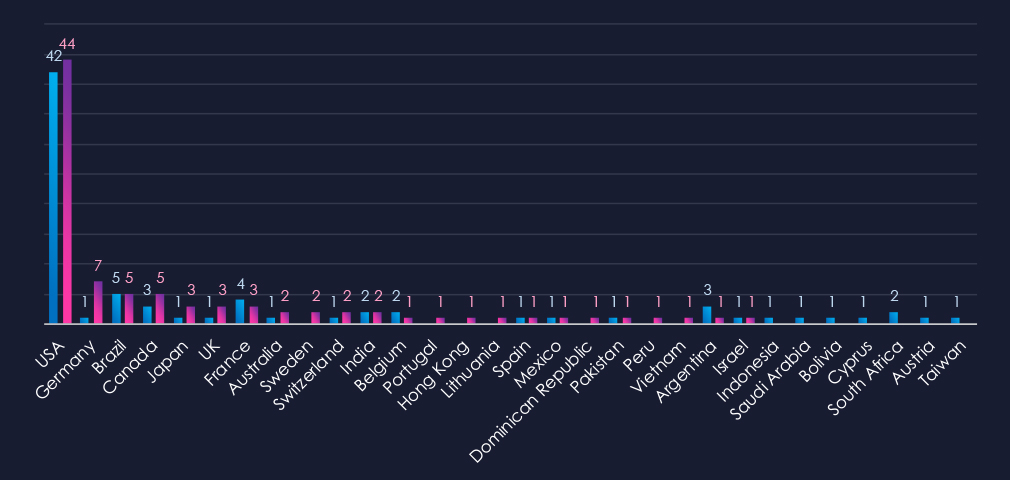
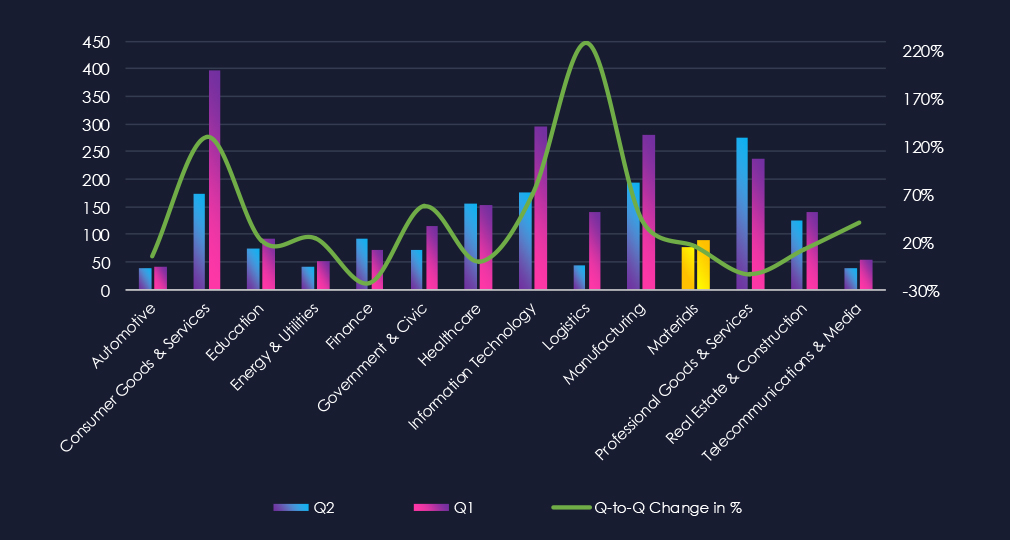
The chart shows quarter-to-quarter changes in targeted countries. Data is sorted by last 90 days and compared to the previous 90 days marked blue.
The USA recorded 44 victims in the last 90 days, representing 49% of all victims. Germany in second place recorded a significant increase. Brazil placed third.

The materials industry placed 10th out of 14 monitored industries recording 90 victims in the last 90 days.
Overall share decreased from 4.8% to 4.1% of all ransomware victims.
Monthly Activity Trends
The monthly activity was sustained across the last 180 days with mild spikes during November and March.
Cl0p was the most active gang overall followed by Akira, Play, and RansomHub.
Ransomware Gangs
A total of 27 out of 69 active ransomware groups targeted this industry in the past 90 days:
Cl0p: The most active with 13 victims but only 3.8% of their victims are from the materials sectors (15 out of 398 victims).
Monti: Highest share in top 10 gangs with 26.7% of victims in this industry (4 out of 15 victims), suggesting a focused interest.
Overall only 2 out of the top 10 gangs recorded above 10% share of their victims in materials, underlining lower risk for the industry.
Geographic Distribution
The geographic distribution of ransomware victims in the materials industry is mostly represented by the USA (44) accounting for 49% of all victims. Germany, Brazil, Canada, the UK, and Japan are in the top 5 most attacked countries.
In total, 23 countries recorded ransomware victims in this industry in the last 90 days, which is exactly the same as the previous 90 days, although some countries differ.
For a comprehensive, up-to-date global ransomware tracking report, please refer to our new monthly “Tracking Ransomware” series here.
Over the past 90 days, the materials industry experienced low levels of threat activity from APT campaigns, underground chatter, and vulnerabilities, with similarly low but persistent ransomware incidents:
APT Campaigns: Only 1 out of 5 observed campaigns (20%) targeted materials—consistent with the prior period (1 out of 6). The single March campaign was linked to Chinese actors Salt Typhoon and Volt Typhoon, impacting 10 countries where web apps, OS, routers, and network monitoring tools were compromised.
Underground & Dark Web Chatter: The sector’s chatter spiked by 38% in the mid-period, then dropped 25%, though remaining above the initial baseline. Ransomware, data leaks, and data breaches dominated discussions. Web exploits saw a sharp drop, while hacktivism also plummeted. However, web hack/exploit activity remained higher than at early levels, indicating ongoing probing of materials-related systems.
Vulnerabilities: Materials accounted for 1.19% of industry vulnerabilities, ranking 12th out of 13. After a decline in the previous period, March saw a resurgence in critical categories like remote code execution (RCE) and cross-site scripting (XSS), suggesting a renewed focus on externally accessible systems. Denial of Service and memory/buffer flaws persisted at lower levels, with privilege escalation and injection attacks disappearing this month.
Ransomware: Ranked 10th in frequency with 90 victims, the materials industry’s overall share decreased from 4.8% to 4.1%. Activity was steady with mild spikes in November and March. Of 69 active groups, 27 targeted materials. Cl0p led in victim count but focused only 3.8% of its attacks on this sector, whereas Monti showed a higher proportional interest (26.7%). The U.S. constituted 49% of identified victims, followed by Germany, Brazil, Canada, and the U.K., spanning 23 affected countries.