


The CYFIRMA Industry Report delivers original cybersecurity insights and telemetry-driven statistics of global industries, covering one sector each week for a quarter. This report focuses on the Telecommunications & Media industry, presenting key trends and statistics in an engaging infographic format.
Welcome to the CYFIRMA infographic industry report, where we delve into the external threat landscape of the telecommunications & media industry over the past three months. This report provides valuable insights and data-driven statistics, delivering a concise analysis of attack campaigns, phishing telemetry, and ransomware incidents targeting the telecommunications & media industry.
We aim to present an industry-specific overview in a convenient, engaging, and informative format. Leveraging our cutting-edge platform telemetry and the expertise of our analysts, we bring you actionable intelligence to stay ahead in the cybersecurity landscape.
CYFIRMA provides cyber threat intelligence and external threat landscape management platforms, DeCYFIR and DeTCT, which utilize artificial intelligence and machine learning to ingest and process relevant data, complemented by manual CTI research.
For the purpose of these reports, we leverage the following data from our platform. These are data processed by AI and ML automation based on both human research input and automated ingestions.
While this report contains statistics and graphs generated primarily by automation, it undergoes thorough review and enhancement for additional context by CYFIRMA CTI analysts to ensure the highest quality and provide valuable insights.
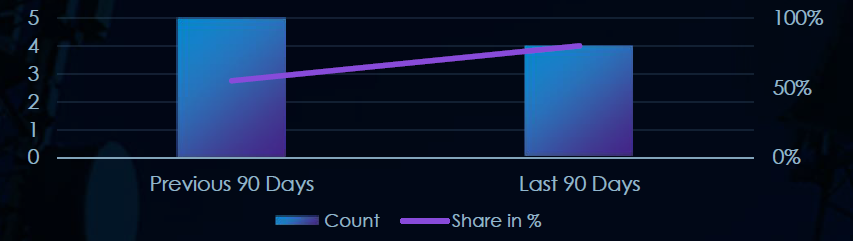
Telecommunications & media organizations did feature in 4 of the 5 observed campaigns, which is a presence in 80% of all campaigns. This is a decrease from 5 campaigns in the previous period, however, an increase in overall share from a 55% presence.

February and March recorded 2 campaigns each. January and April so far did not record any telecommunications & media victims.
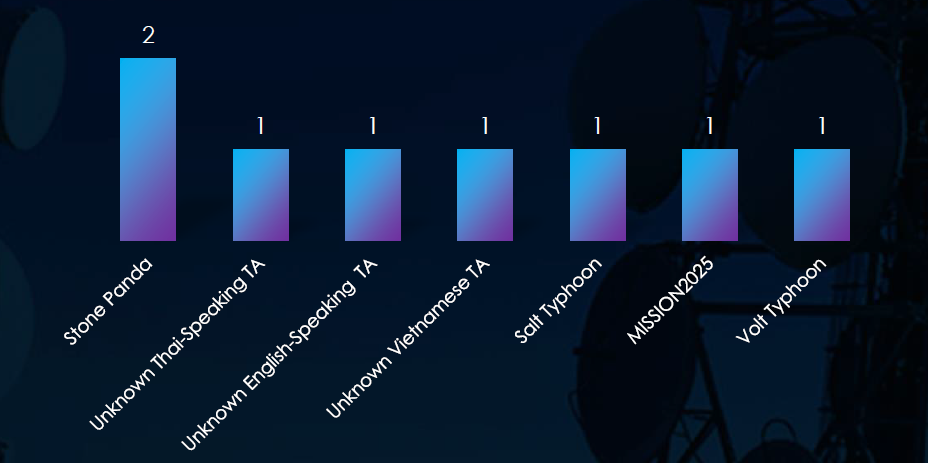
The observed campaigns are split evenly between Chinese nation-state threat actors and Unattributed threat actors with overlapping TTPs.
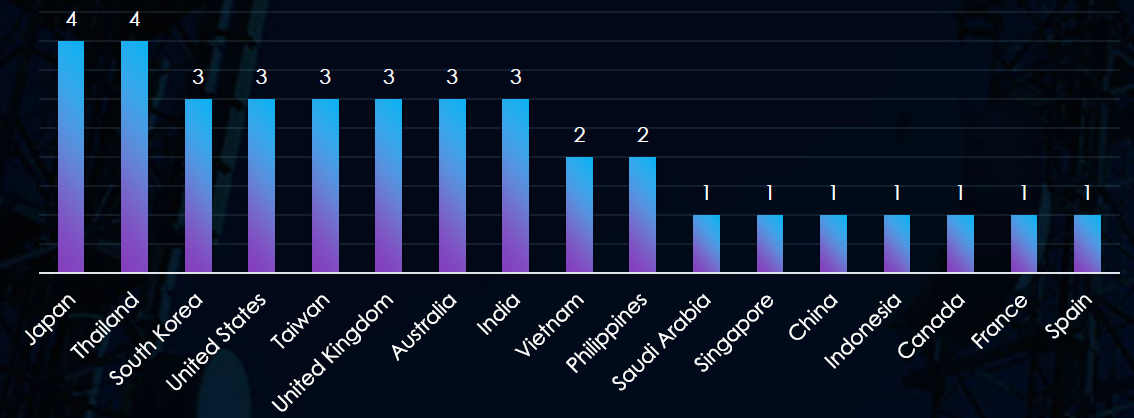
Victims of the observed attack campaigns have been recorded in 17 different countries. Japan and Thailand have reported victims in all four campaigns. Overall, most of the countries listed correspond with known points of interest of threat actor-linked countries, primarily in the Asia-Pacific region.
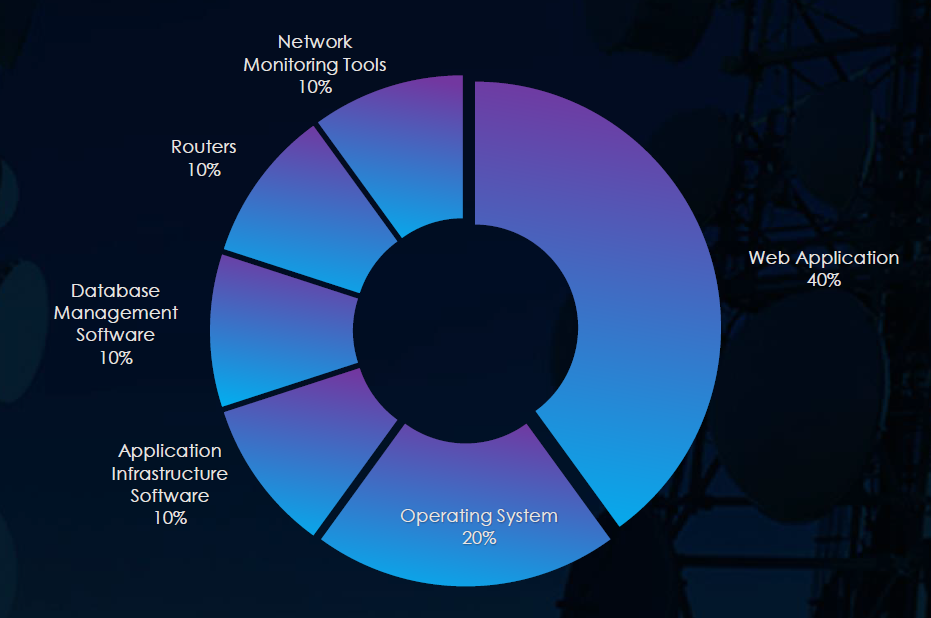
All four observed campaigns targeted web applications, two targeted operating systems and we have also seen app infrastructure, DB management, routers and network tools.

In the past 90 days, telecommunications & media organizations have been significantly affected by advanced persistent threat (APT) campaigns. 4 in 5 observed APT campaigns targeted this industry, representing 80% presence.
This is one less than the previous 90-day period, however, a higher share, when 5 out of 9 campaigns targeted the telecommunications & media industry.
Monthly Trends
The observed campaigns occurred during February and March, both months recording 2 campaigns.
Key Threat Actors
The campaign attribution is split in half between Chinese nation-state threat actors and unattributed Vietnamese & Thai-speaking threat actors.
Geographical Impact
The campaigns have affected a total of 17 countries. Notably Japan and Thailand were targeted in all 4 observed campaigns.
Targeted Technologies
Web applications were targeted in all four campaigns while operating systems were targeted in two. Additionally, application infrastructure, routers, network tools, and database management software were targeted.
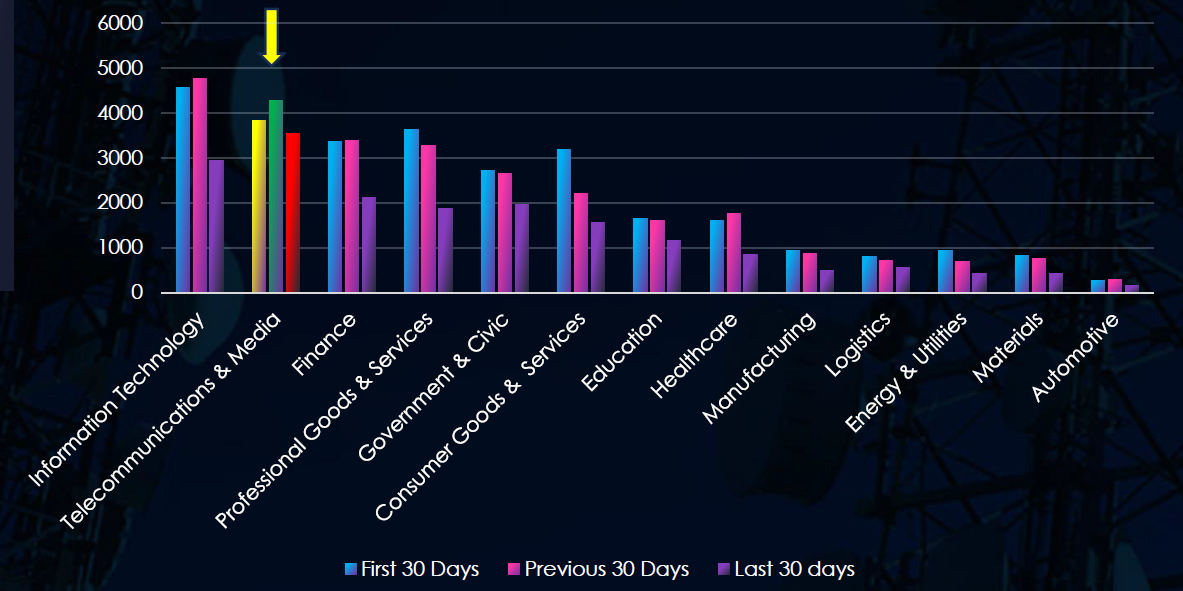
Over the past three months, CYFIRMA’s telemetry has identified 11,638 mentions of telecommunications & media out of a total of 73,561 industry mentions. This is from a total of 558,920 posts across various underground and dark web channels and forums.
Telecommunications & media ranked 2nd out of 13 industries in the last 90 days with a share of 16.67% of all detected industry chatter.
Below is a breakdown of 30-day periods of all mentions.
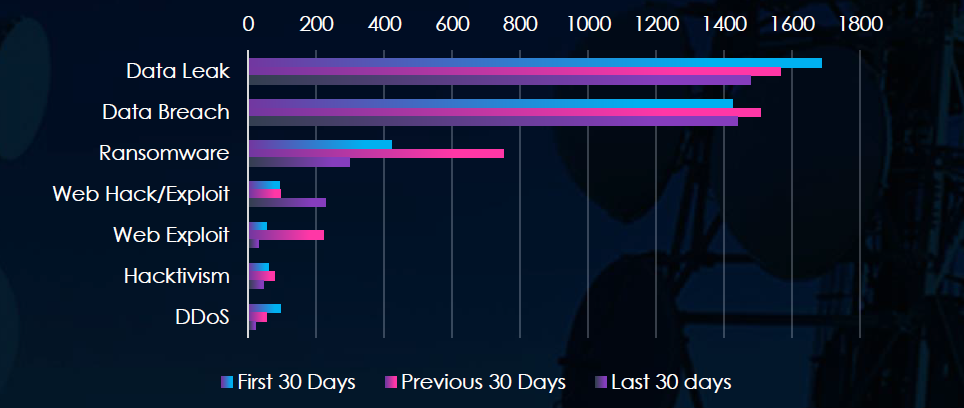
Data leaks and data breaches were the most common categories of recorded chatter for the telecommunications & media industry. Also notable is an increase in ransomware chatter during March.

In total, telecommunications & media comprises 16.67% of all detected industry underground and dark web chatter in the last 90 days, ranking 2nd out of 13 industries.
Below are observed key trends across 90 days:
Data Leak & Breach remain high and stable.
Ransomware surged in the middle period, then dropped sharply:
420 → 750 → 299 (↓60% from peak)
Web-Based Threats Fluctuate Significantly
Web Hack/Exploit:
92 → 94 → 226 → Significant jump in the last 30 days (↑140%)
Web Exploit:
53 → 220 → 31 → Spiked in the middle, then dropped (↓86%)
Hacktivism & DDoS Activity Declining
Hacktivism: 60 → 77 → 43
DDoS: 94 → 53 → 20 → Consistent downward trend (↓79% overall)
Key Takeaways
Over the past three months, CYFIRMA’s telemetry has identified 317 mentions of the telecommunications & media industry out of a total of 4,962 industry mentions. This is from a total of 11,748 CVE published in 90 days.
The telecommunications & media industry ranked 4th out of 13 industries in the last 90 days with a share of 6.39% of all detected industry-linked vulnerabilities.
Below is a breakdown of 30-days periods of all mentions.
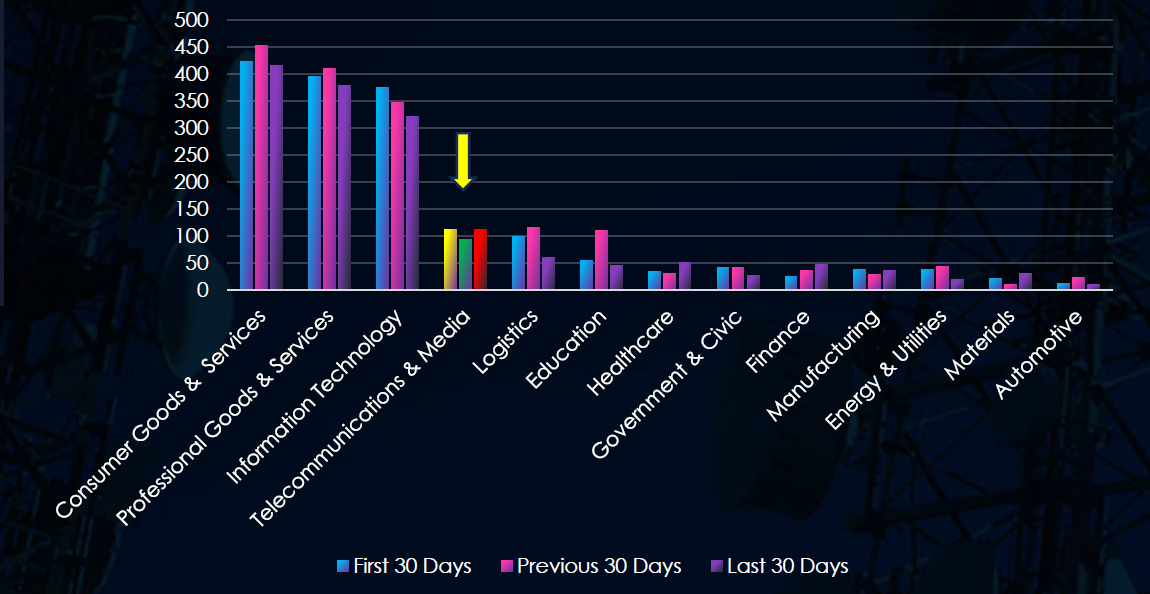
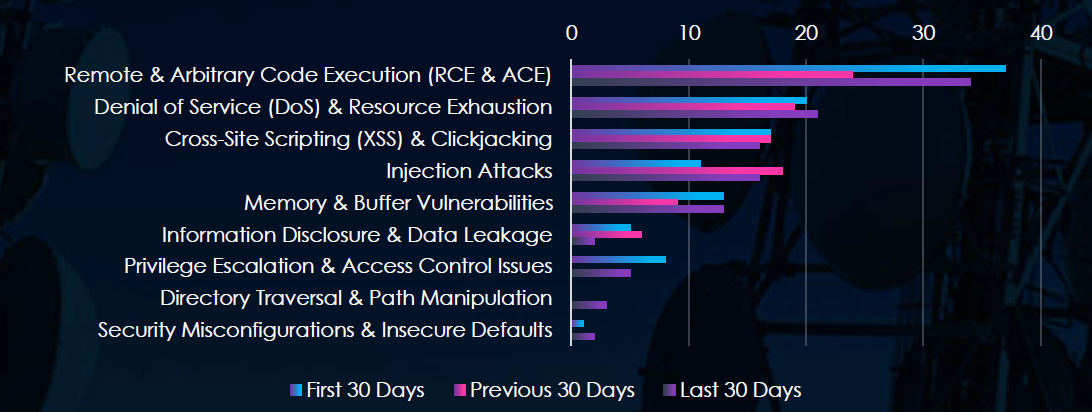
Remote & Arbitrary Code Execution are the most common vulnerabilities, followed by somewhat equally frequent DoS, XSS, and Injection Attacks vulnerabilities.

In total, telecommunications & media comprise 6.39% of all detected industry vulnerabilities in the last 90 days, ranking 4th out of 13 industries.
Below are observed key trends across 90 days.
Consistently High-Risk Categories
Remote Code Execution (RCE): 37 → 24 → 34
Denial of Service (DoS): 20 → 19 → 21
Steady presence suggests ongoing concerns for service disruption, especially critical in telecom.
Other Notable Vulnerabilities (Last 30 Days)
Cross-Site Scripting (XSS): 16 (stable across all periods)
Injection Attacks: 16 (slight dip from peak of 18)
Memory/Buffer Issues: 13 (bounced back to Jan levels)
These suggest that web-based and code-level risks remain persistent.
Key Takeaways
In the past 90 days, CYFIRMA has identified 57 verified ransomware victims in the telecommunications & media industry. This accounts for 2.60% of the overall total of 2,194 ransomware victims during the same period, placing the telecommunications & media industry 12th out of 14 industries.
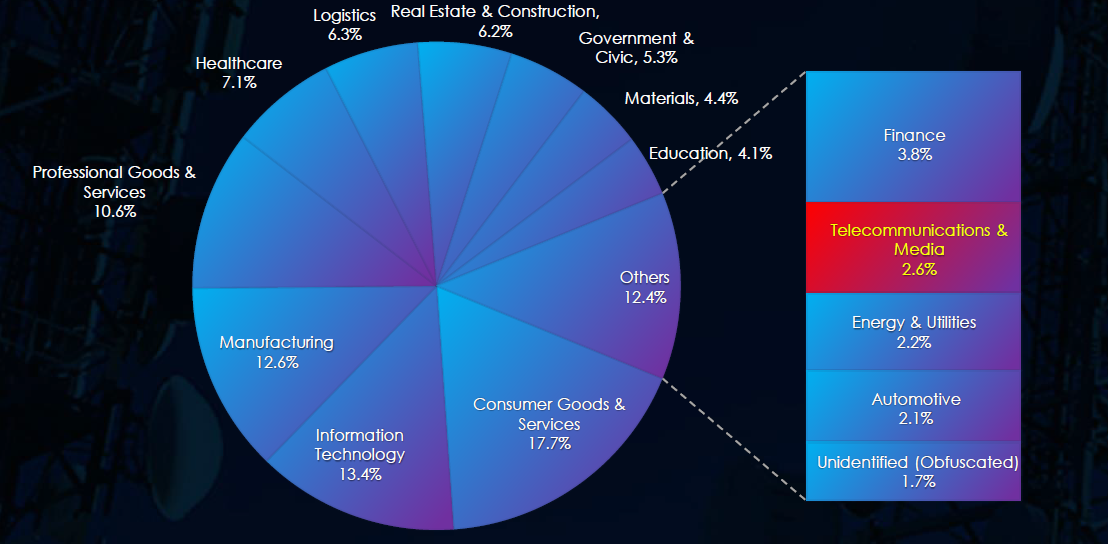
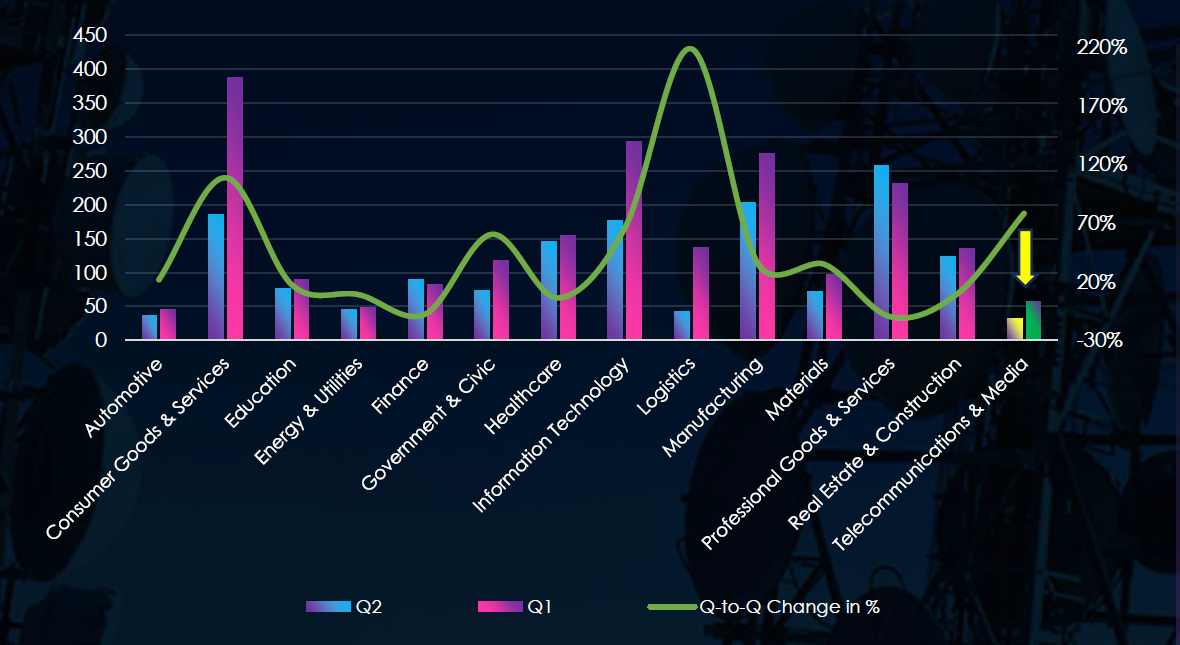
Furthermore, a quarterly comparison reveals a significant increase of interest in the telecommunications & media industry of 78.1% from 32 to 57 victims with the overall share increasing from 2.0% to 2.6% of all victims.
INDUSTRY MONTHLY ACTIVITY CHART
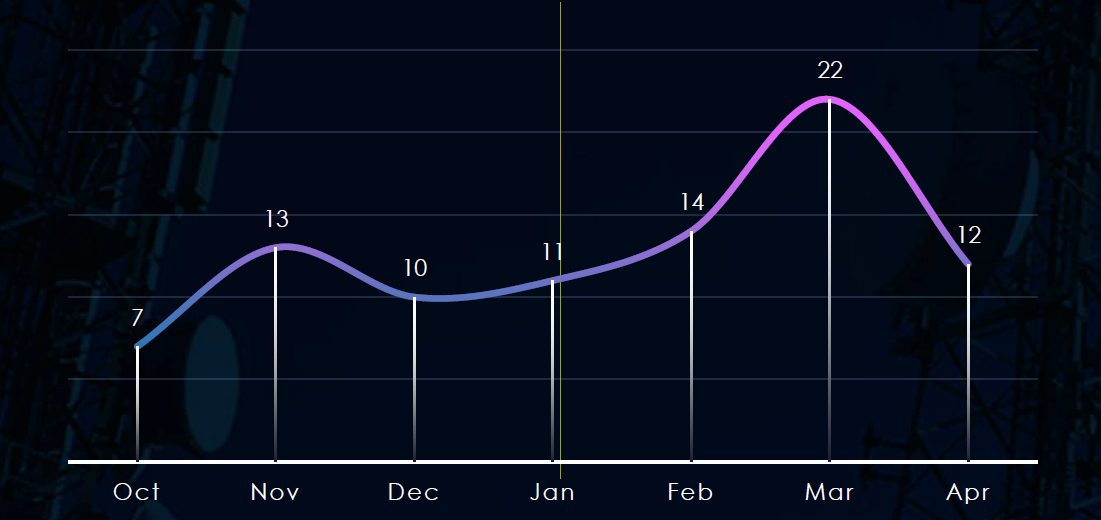
Over the past 180 days, we have observed low but sustained activity across months with a spike during March doubling the average number.
BREAKDOWN OF ACTIVITY PER GANG
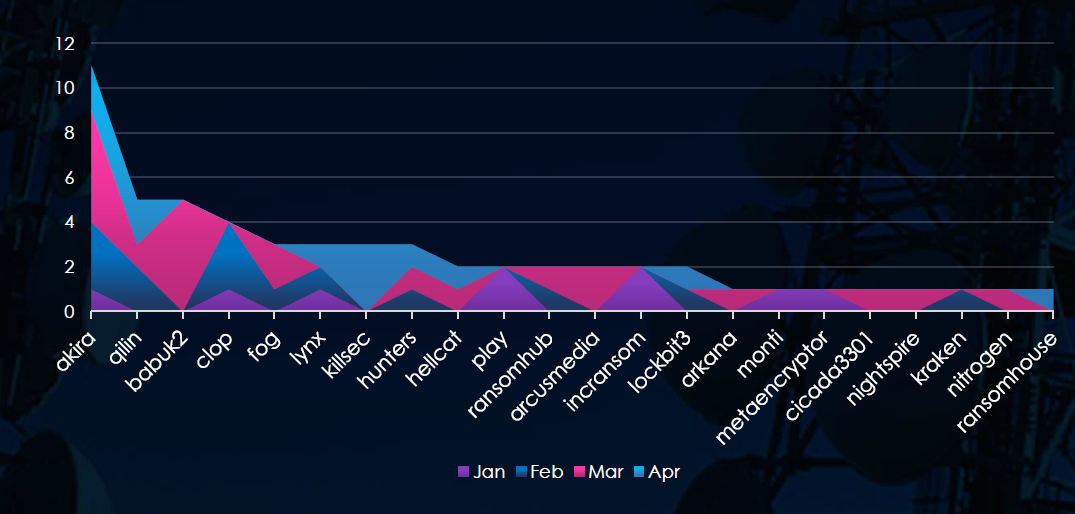
A breakdown of the monthly activity per gang provides insights into which gangs were active each month. For example, the most active gang Akira has recorded the most victims in February and March. On other hand Babuk2 recorded all victims in March.
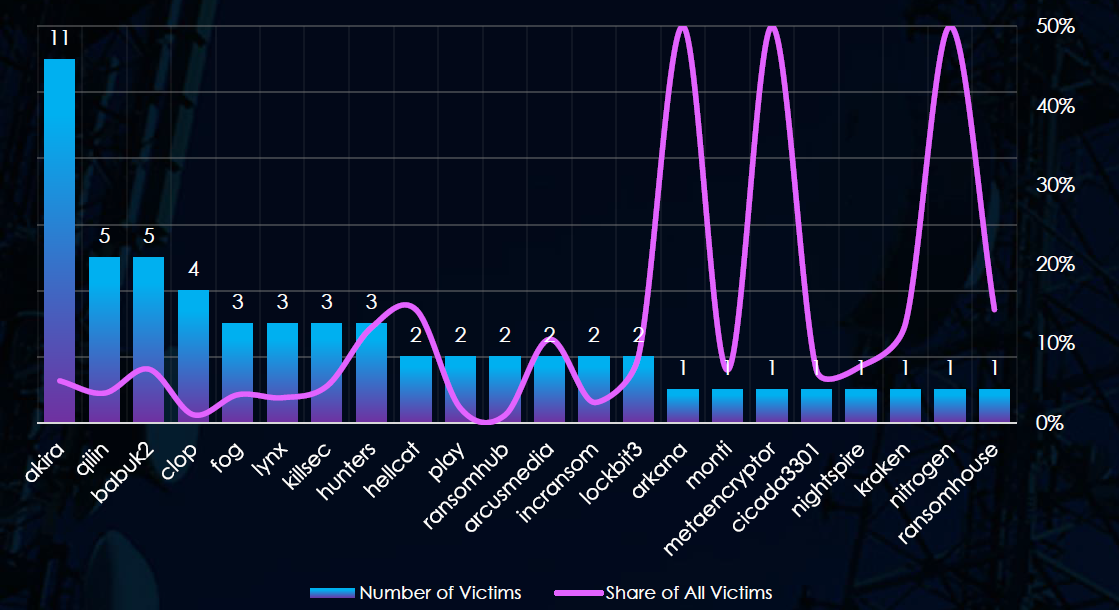
In total 22 out of 69 gangs were active in the last 90 days. Akira gang recorded the most victims (11), followed by Qilin and Babuk2 (5).
The share of all victims for most gangs in this industry is relatively low. Akira recorded only 5.2% of their victims in this industry.
Apart from Hunters (12%) and Hellcat (14.3%) no other gangs in the top 10 showed a significant share. Few gangs recorded 1 out of 2 victims (50%).
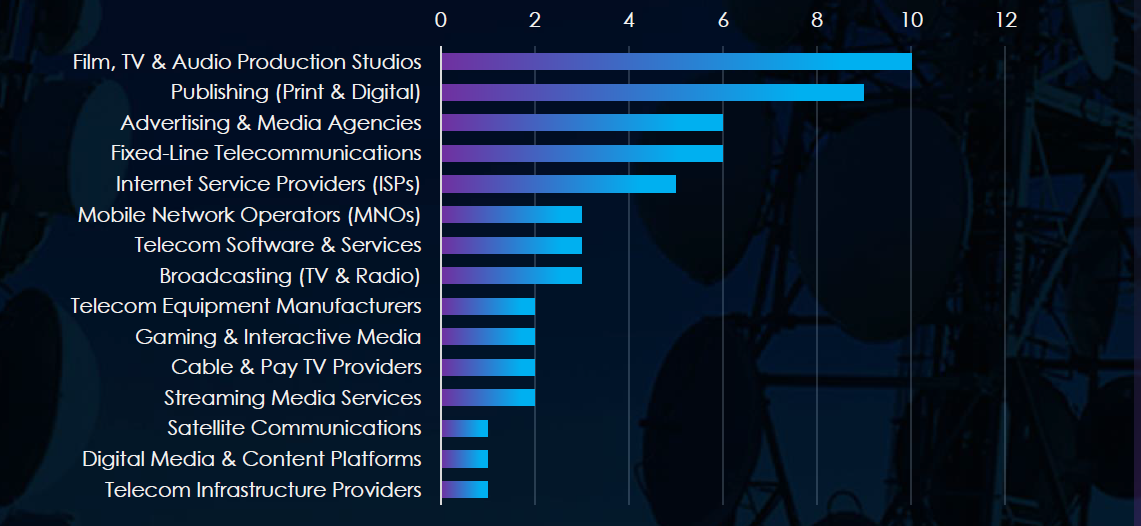
Film, TV & Audio Production Studios, and Publishing were the most frequent victims in the telecommunications & media industry.
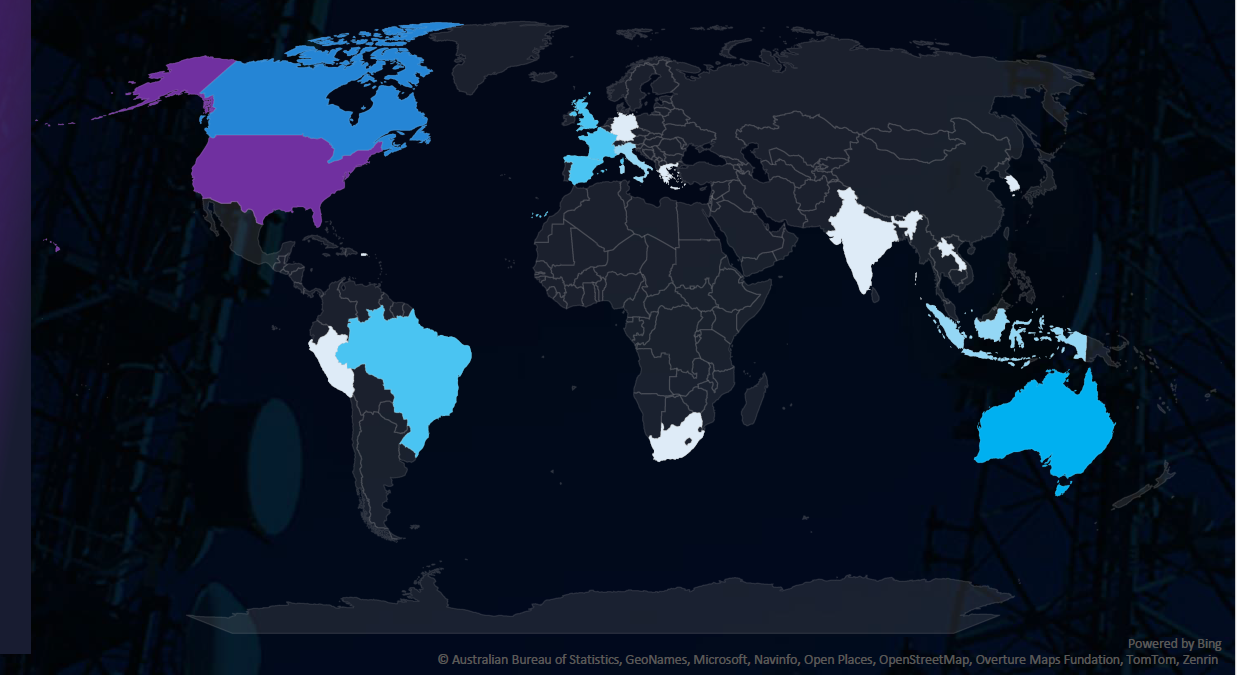
The geographic distribution heatmap underscores the widespread impact of ransomware, highlighting the countries where victims in this industry have been recorded.
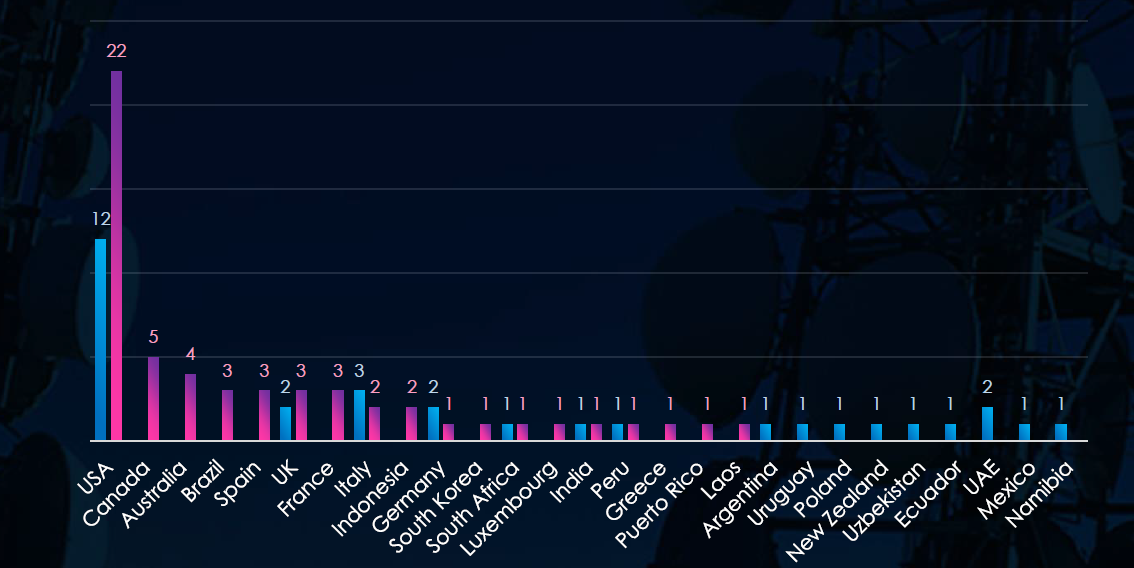
The chart shows quarter-to-quarter changes in targeted countries. Data is sorted by last 90 days and compared to the previous 90 days marked blue.
The USA recorded 22 victims in the last 90 days, representing 39% of all victims. Canada, Australia, and Brazil recorded 5, 4, and 3 victims respectively while not recording any in the previous 90 days.

The telecommunications & media industry placed 12th out of 14 monitored industries, recording 57 victims in the last 90 days, a significant increase of 78.1% from 32 victims in the previous 90-day period.
Overall share increased from 2.0% to 2.6% of all ransomware victims.
Monthly Activity Trends
Monthly activity was low, but sustained across last 180 days with major spike in March which doubles the monthly average.
Akira was the most active gang overall followed by Qilin and Babuk2.
Ransomware Gangs
A total of 22 out of 69 active ransomware groups targeted this industry in the past 90 days:
Akira: The most active with 11 victims but only 5.3% of their victims from the telecom & media sectors (11 out of 208 victims).
Hellcat: Highest share in top 10 gangs. 14.3% of victims in this industry (2 out of 14 victims).
Overall, only 2 out of the top 10 gangs recorded above 10% share of their victims in telecom & media, underlining lower risk for the industry.
Geographic Distribution
The geographic distribution of ransomware victims in this industry is mostly represented by the USA (22) accounting for 39% of all victims. Followed by Canada, Australia, and Brazil which had no victims in the previous 90-day period.
In total, 18 countries recorded ransomware victims in this industry in the last 90 days, two more than the previous 90 days, although 9 countries did not record new victims in the last 90 days.
For a comprehensive, up-to-date global ransomware tracking report, please refer to our new monthly “Tracking Ransomware” series here.
APT Campaigns: Four of the five APT operations observed in the last 90 days—an 80 % hit rate—targeted the telecommunications & media sector. Two campaigns appeared in February and two in March. Half were attributed to Chinese state actors, the remainder to Vietnamese- and Thai-speaking groups. Every campaign exploited public-facing web applications; two also abused operating-system flaws, while others leveraged routers, network tools, and database infrastructure. Seventeen countries were affected, with Japan and Thailand hit in every case, underscoring sustained geopolitical and espionage pressure on telecom assets.
Underground & Dark-web chatter: The sector generated 16.7 % of all industry-specific chatter—the second highest of the 13 industries tracked. Mentions of data breaches and leaks stayed consistently high. Ransomware references spiked mid-period, and web hack/exploit talks surged in the final 30 days, signaling renewed attacker interest in telecom portals and infrastructure. Hacktivism and DDoS discussions declined, suggesting a shift toward data theft and web-based vectors.
Vulnerabilities: Telecommunications & media accounted for 6.4 % of reported CVEs (4th place). Remote code execution and denial of service flaws remained the most common, posing clear service-disruption risks. Web-application issues—cross-site scripting, injection attacks, and a rebound in memory/buffer bugs—persisted, aligning with the dark-web focus on web exploits.
Ransomware: Although still the 12th most victimized sector (57 incidents), ransomware cases rose 78 % quarter-over-quarter, lifting the sector’s share from 2.0 % to 2.6 %. Twenty-two of 69 active gangs struck telecom & media assets; Akira led in absolute numbers (11 victims, 5 % of its total), while Hellcat showed the highest proportional focus (14 %). The United States accounted for 39 % of victims, with new activity in Canada, Australia, and Brazil. Attacks were recorded in 18 countries overall.